Figure 5. Localization of side population
(SP) cells in the porcine lens. The fluorescent images of Hoechst blue (A)
and
red (B) fluorescence in the porcine lens epithelium were
analyzed using Image Master software. C: Cells with the lowest
levels of blue and red fluorescence are visible as green cells. The
scale bar represents 200 µm.
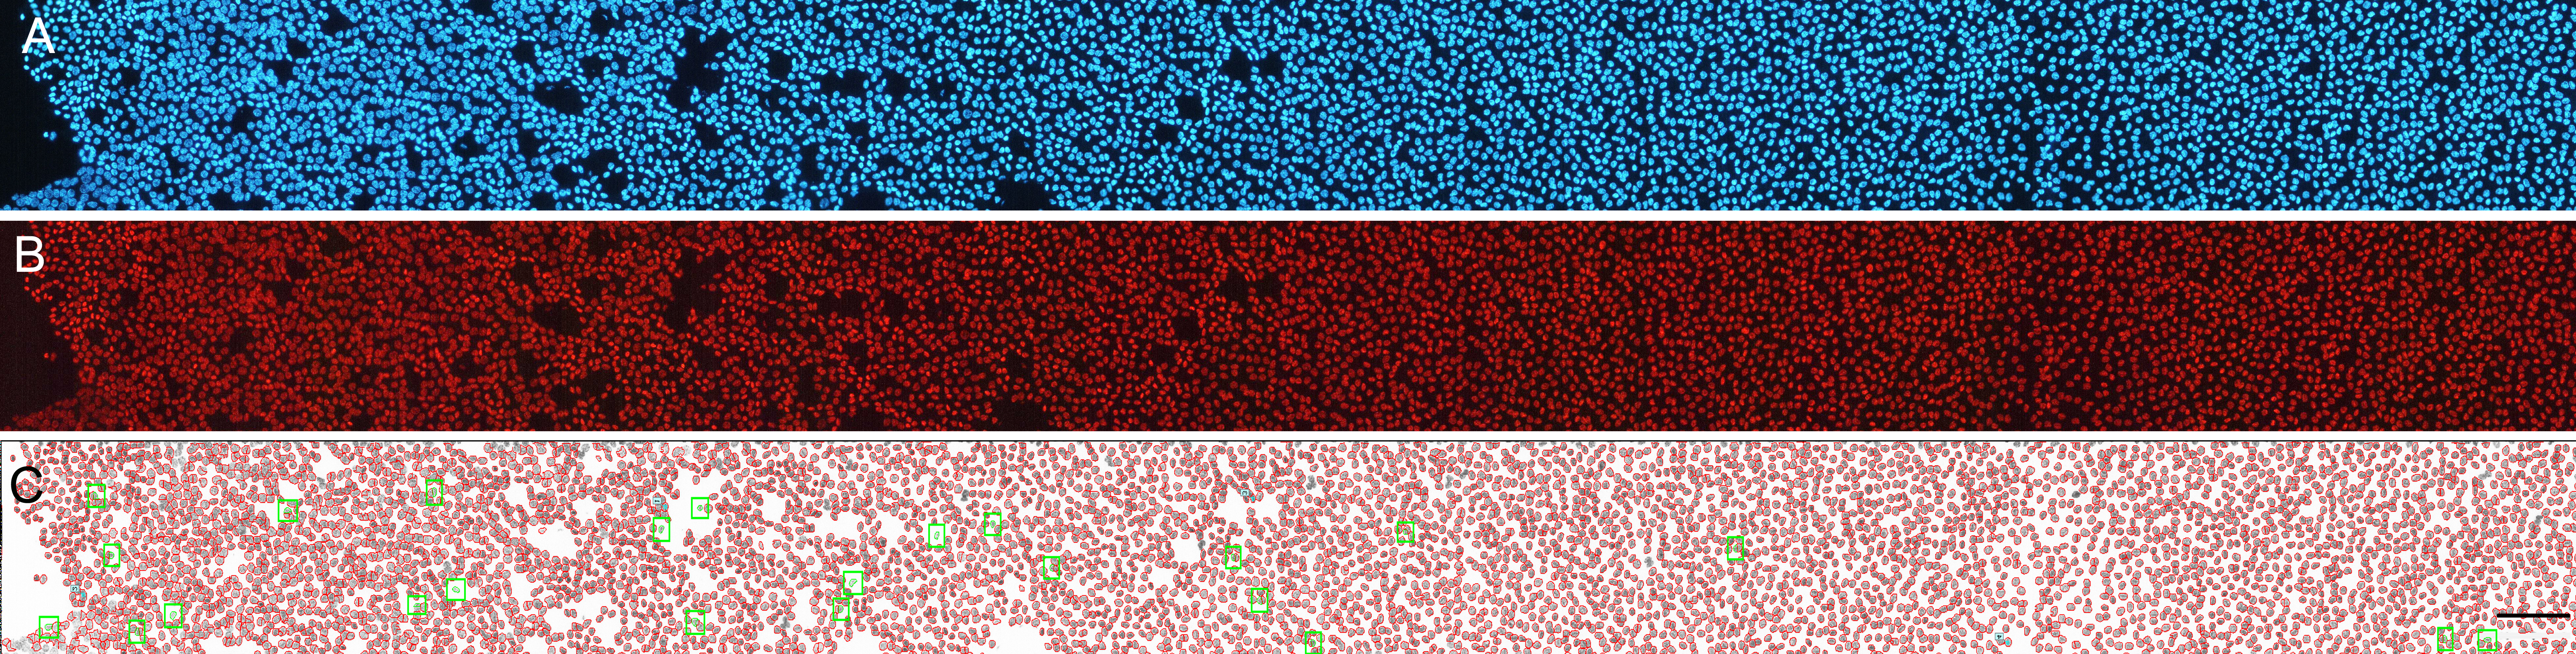
 Figure 5 of Oka, Mol Vis 2010; 16:945-953.