Figure 4. Localization of side population
(SP) cells in the lens epithelium. Mouse lenses were incubated in DMEM
containing Hoechst 33342 for 90 min and then fixed. A shows
Hoechst blue fluorescent image and B shows Hoechst red
fluorescent image of the same mouse lens epithelium. The “+” in (A)
indicates
the center of the lens epithelium. C shows the result
of fluorescent intensity analysis using Image Master software. The
cells with the lowest levels of fluorescence intensity, shown in the
green spot in E, can be seen as green cells highlighted with a
green square in C. D shows high magnification images of
the cells within the areas marked by black square in C. SP
cells localized around the germinative zone of the lens epithelium. The
scale bar represents 100 µm. E shows a plot of the cells at the
indicated levels of intensity of Hoechst blue (vertical axis) and red
fluorescence (horizontal axis).
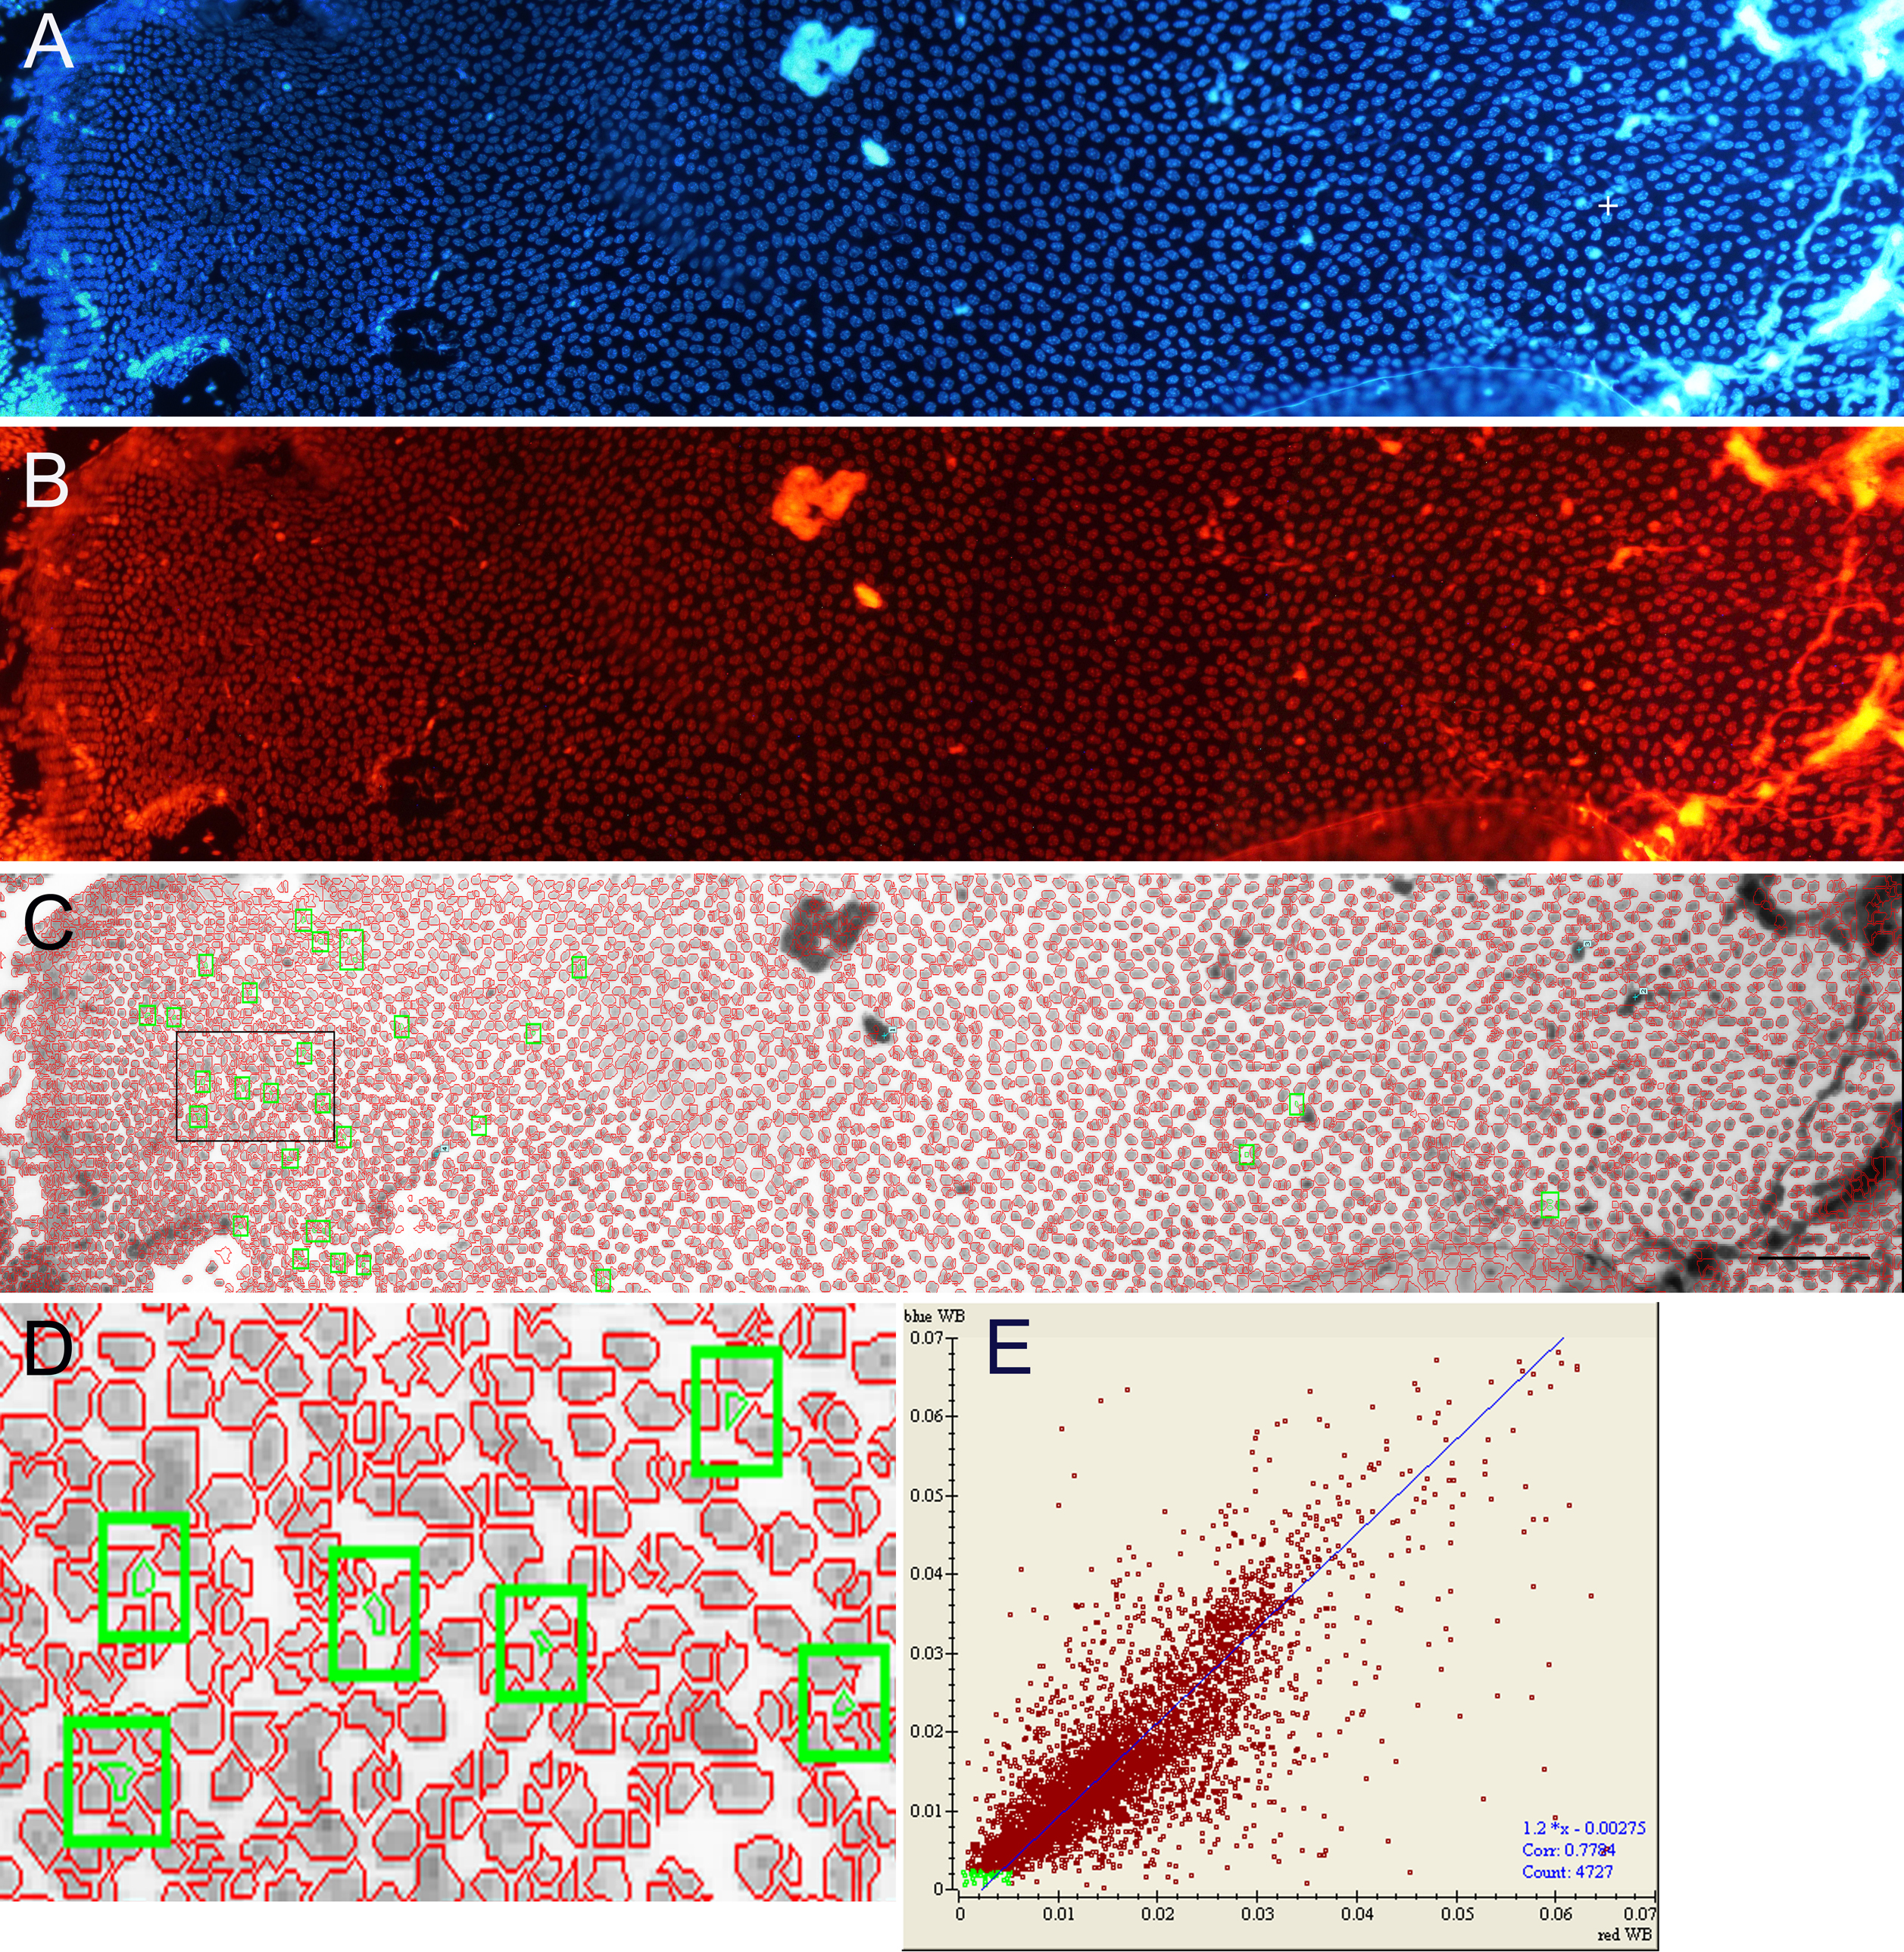
 Figure 4 of Oka, Mol Vis 2010; 16:945-953.