Figure 2. Cell-cycle analysis of side
population (SP) and non-SP cells. SP (A) and non-SP (B)
cells were treated with Nonidet P-40 and propidium iodide (PI), and
then cell-cycle status was analyzed by FACS. The M1 region of the
histogram shows cells in G0/G1 stage, and the M2
region shows cells in G2/M stage. The SP cell population did
not contain cells in the G2/M stage of the cell cycle.
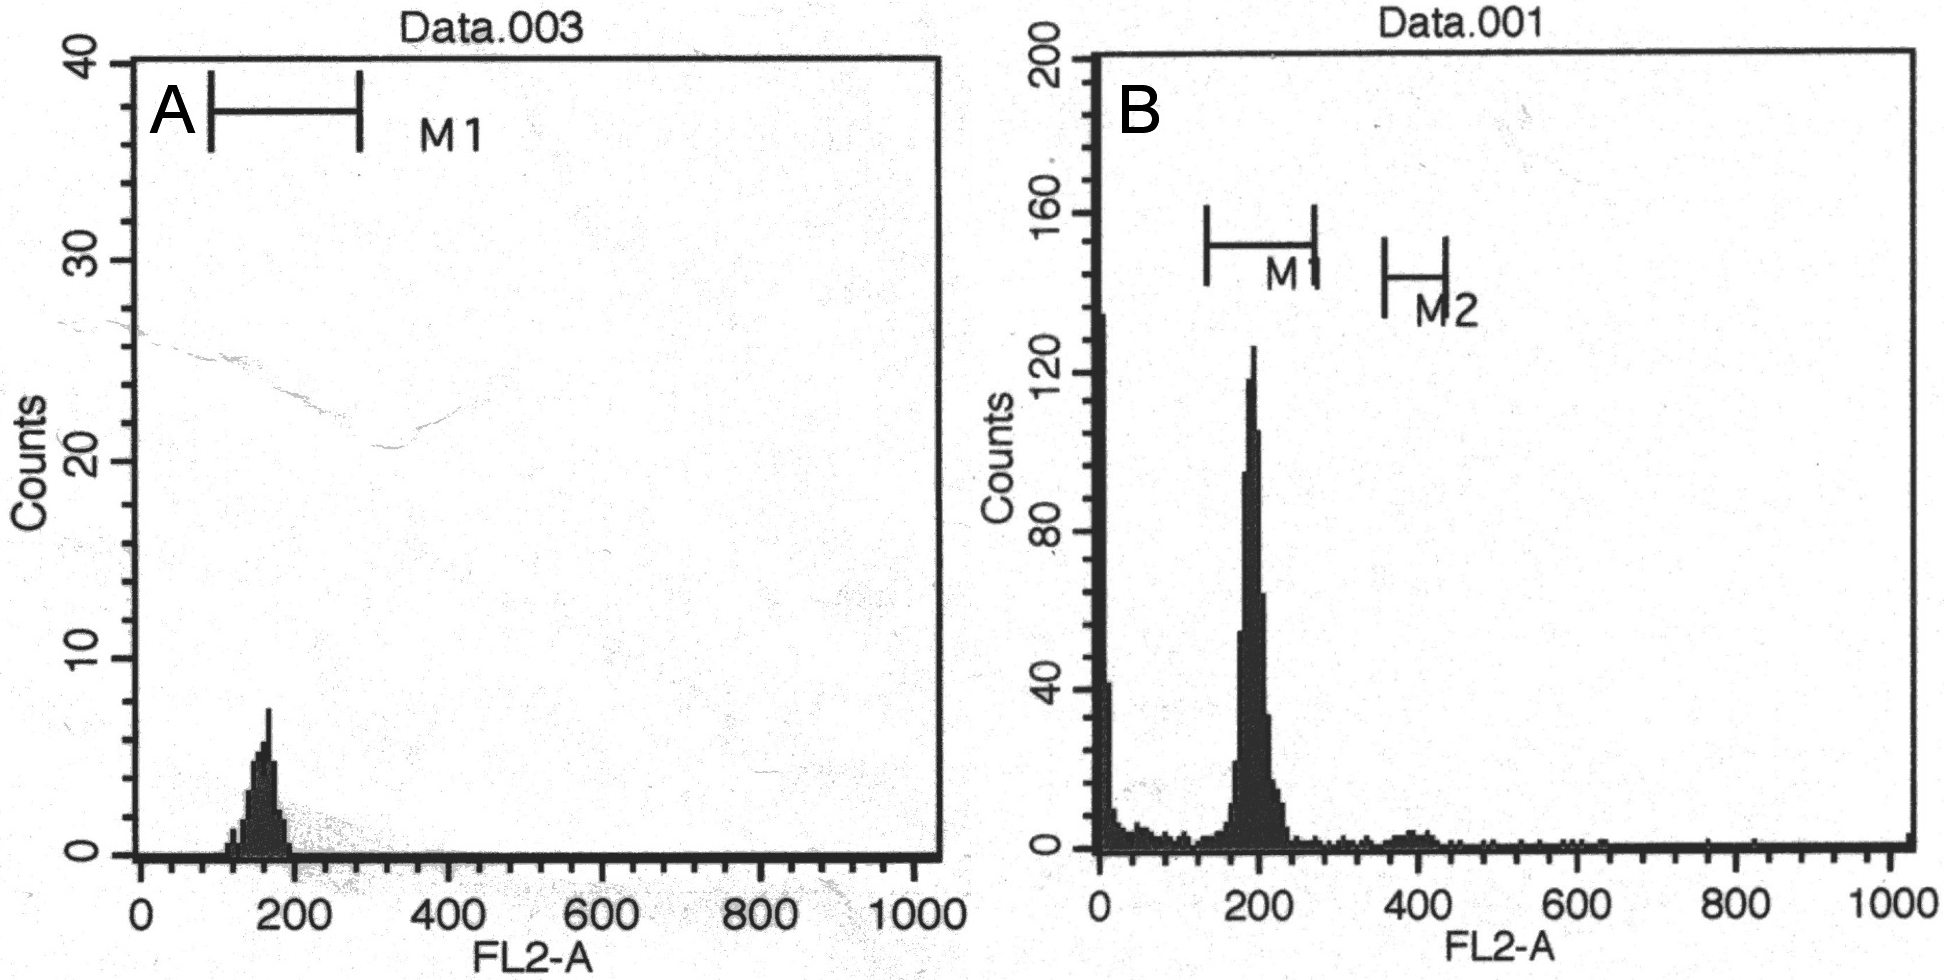
 Figure 2 of Oka, Mol Vis 2010; 16:945-953.