Figure 8. Expression characteristics of
dual promoter vectors constructed using murine opsin promoter (MOPS)
and Xenopus opsin promoter (XOPS) promoters.
pFIN-XOPS-tdTOM-MOPS-GFP (1.6×10⁸ vector genomes/µl; A-J)
or
pFIN-MOPS-GFP-XOPS-tdTOM-WPRE (4.4×10⁸ vector genomes/µl;
K-T) lentivirus was injected into the developing neural tubes of
E2 chicken embryos in ovo. Retinal whole mounts (one retina per
horizontal row) were photographed twice using the exposure duration
shown in lower left of each panel and filters appropriate for detection
of tdTOM or GFP. The merged images (C, H, M, R)
were
analyzed using the co-localization module of the Zeiss AxioVision
Image Suite. The relative percent area (pixels) of each image
containing GFP (green bar) or tdTOM (red bar) fluorescence alone or
both GFP and tdTOM (yellow bar) is shown in panels D, I,
N, S. The images shown in E, J, O,
T were derived from the merged images (C, H, M, R) and
show only those areas of the merged image in which GFP was co-localized
with CHER. The scale bar shown in A is applicable to all images
and equals 50 µm.
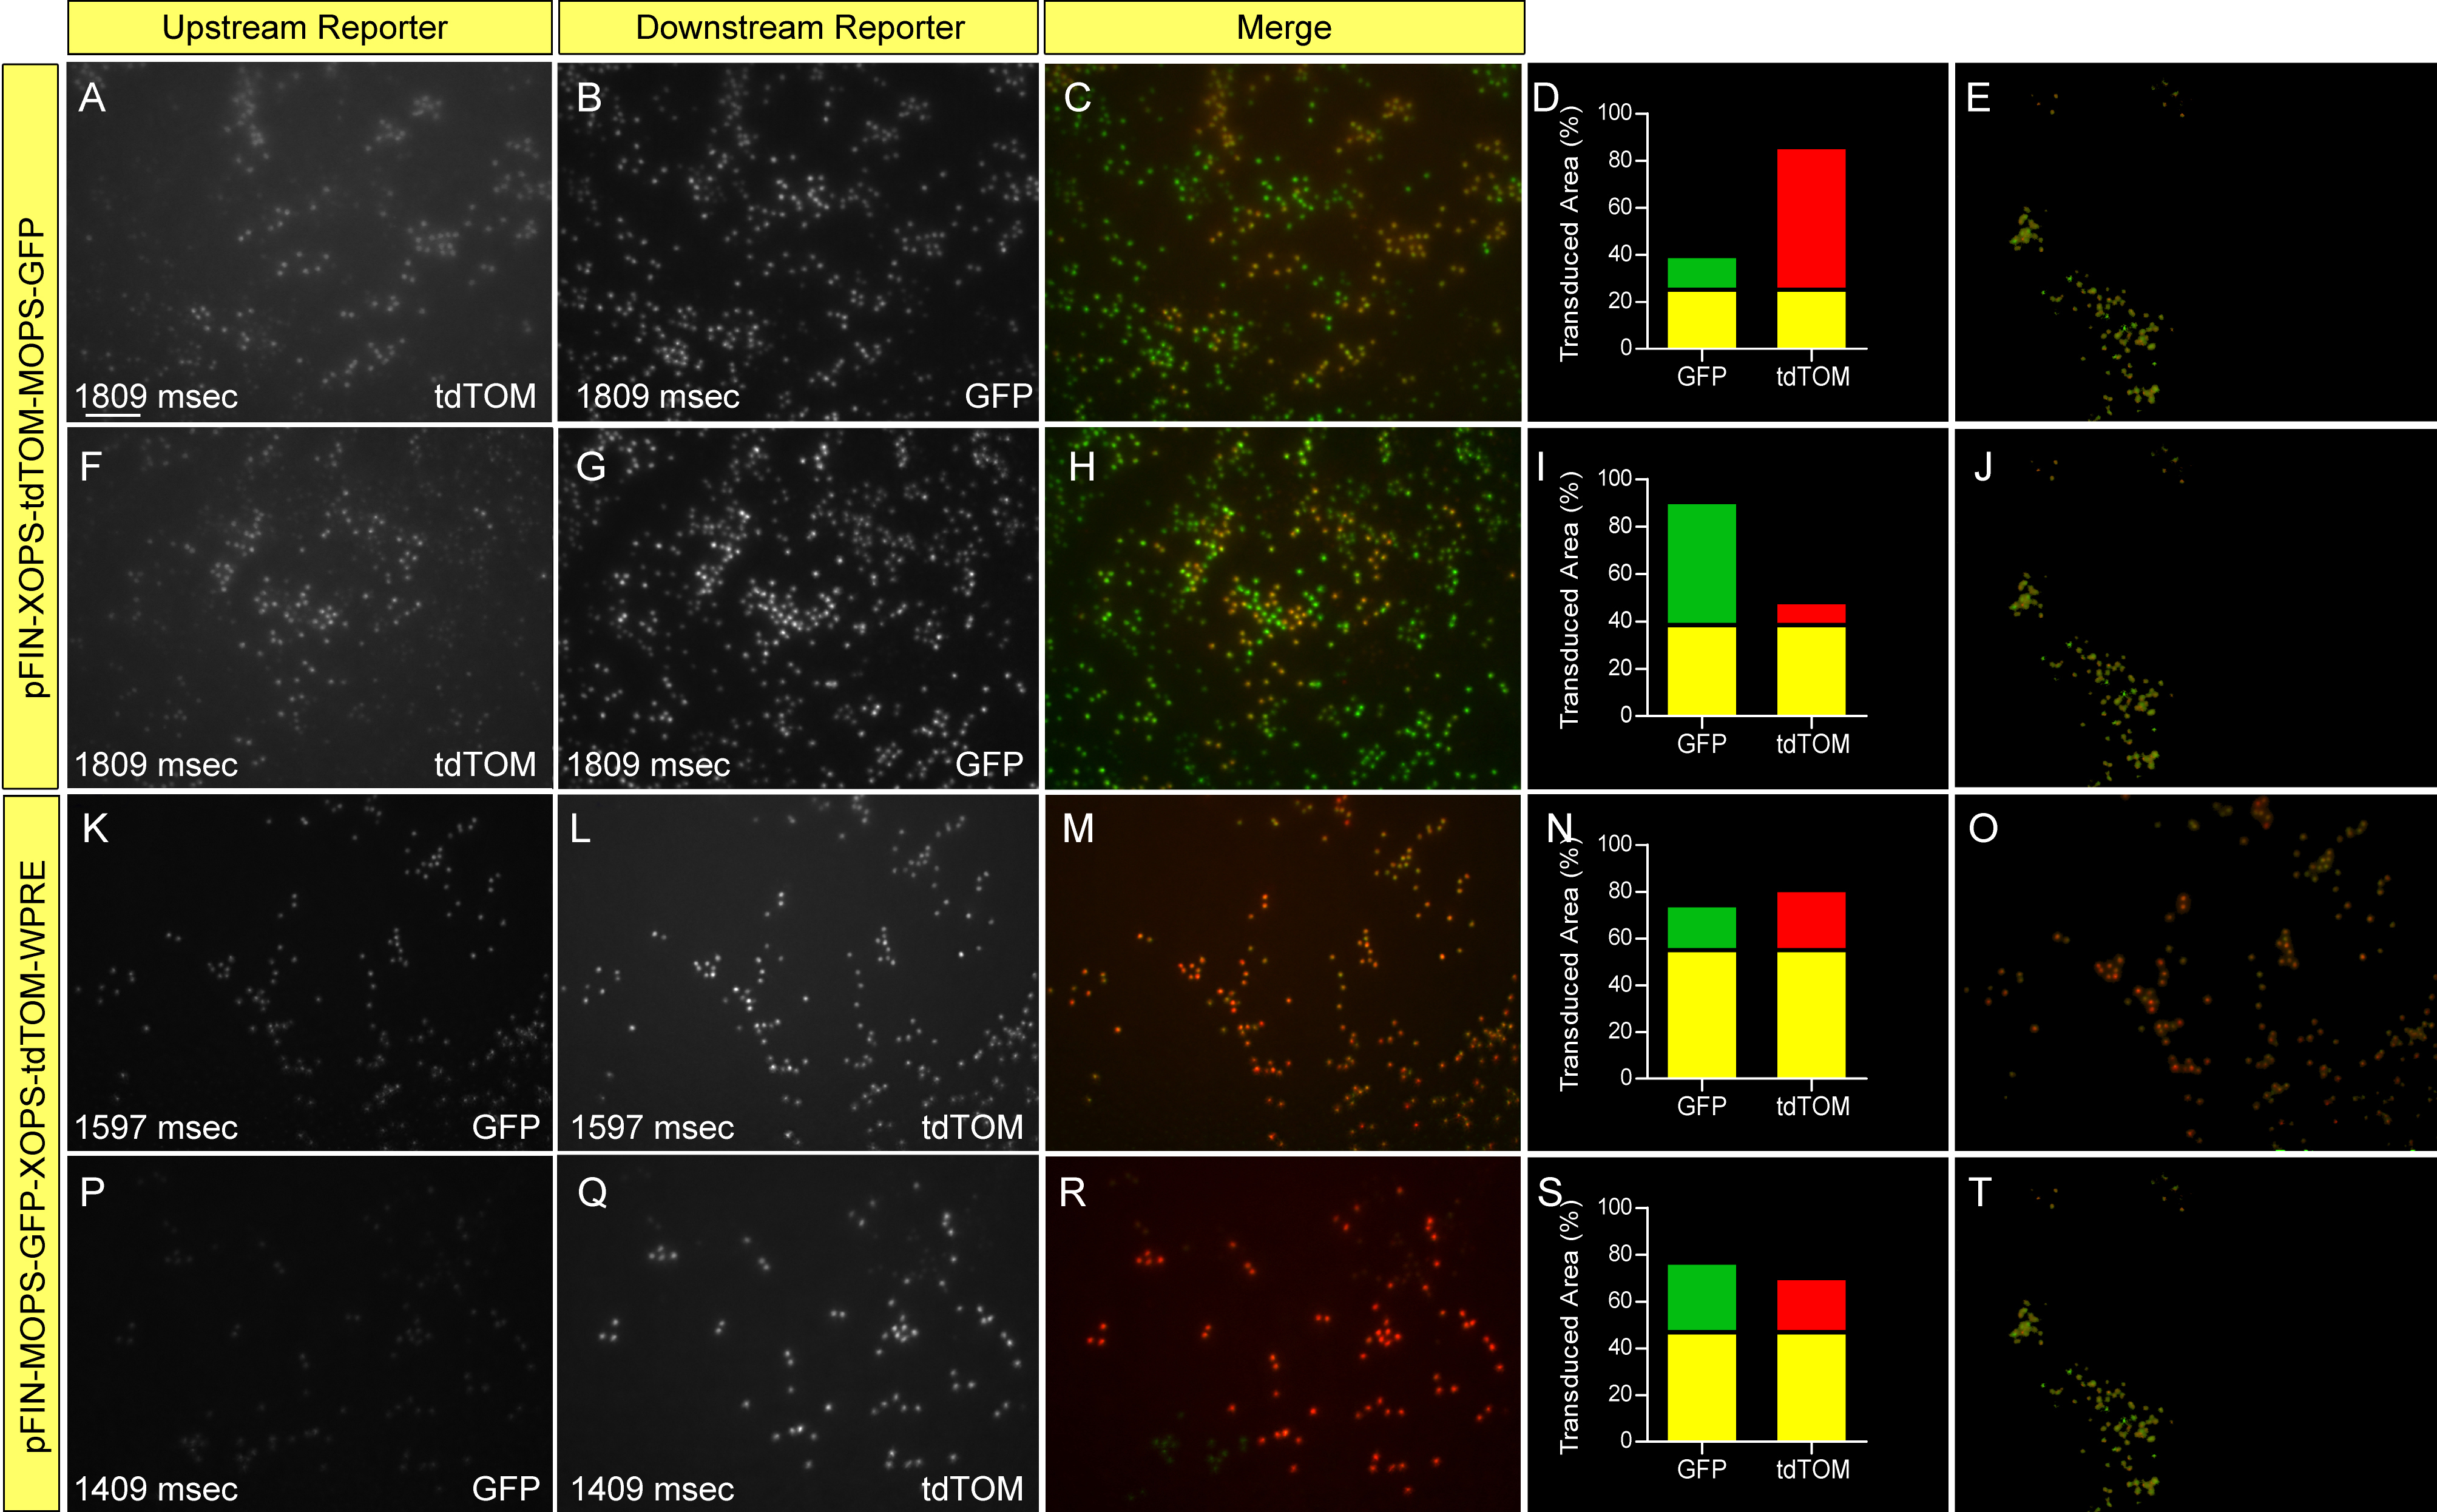
 Figure 8 of Semple-Rowland, Mol Vis 2010; 16:916-934.