Figure 7. The effects of internal
insulators on the expression of the RK-GFP and IRBP156-CHER transgenes
carried by the pFIN-RK-GFP-IRBP156-CHER-WPRE vector. Examination of the
expression of GFP and CHER in retinas transduced with
pFIN-RK-GFP-HS4(2×250)F-IRBP156-CHER-WPRE (3.3×10⁸ vector
genomes/µl; A-J) or pFIN-RK-GFP-HS4(1.2)F-IRBP156-CHER (1.2×10⁸
vector genomes/µl; K-T). Each lentivirus was injected into the
developing neural tubes of E2 chicken embryos in ovo. The retinal whole
mounts were photographed twice using the exposure duration shown in
lower left of each panel and filters appropriate for detection of GFP
or CHER. The GFP and CHER images were merged (C, H, M,
R) and analyzed using the co-localization module of the Zeiss
AxioVision Image Suite. The results of these analyses are expressed as
the percent of the transduced area in the image (pixels) containing
co-localized GFP and CHER (yellow bar) or GFP (green bar) or CHER (red
bar) fluorescence alone D, I, N, S. The
images shown in E, J, O, T were derived
from the merged images (C, H, M, R) and
show only those areas of the merged image in which GFP and CHER were
co-localized. The scale bar shown in A is applicable to all images and
equals 50 µm.
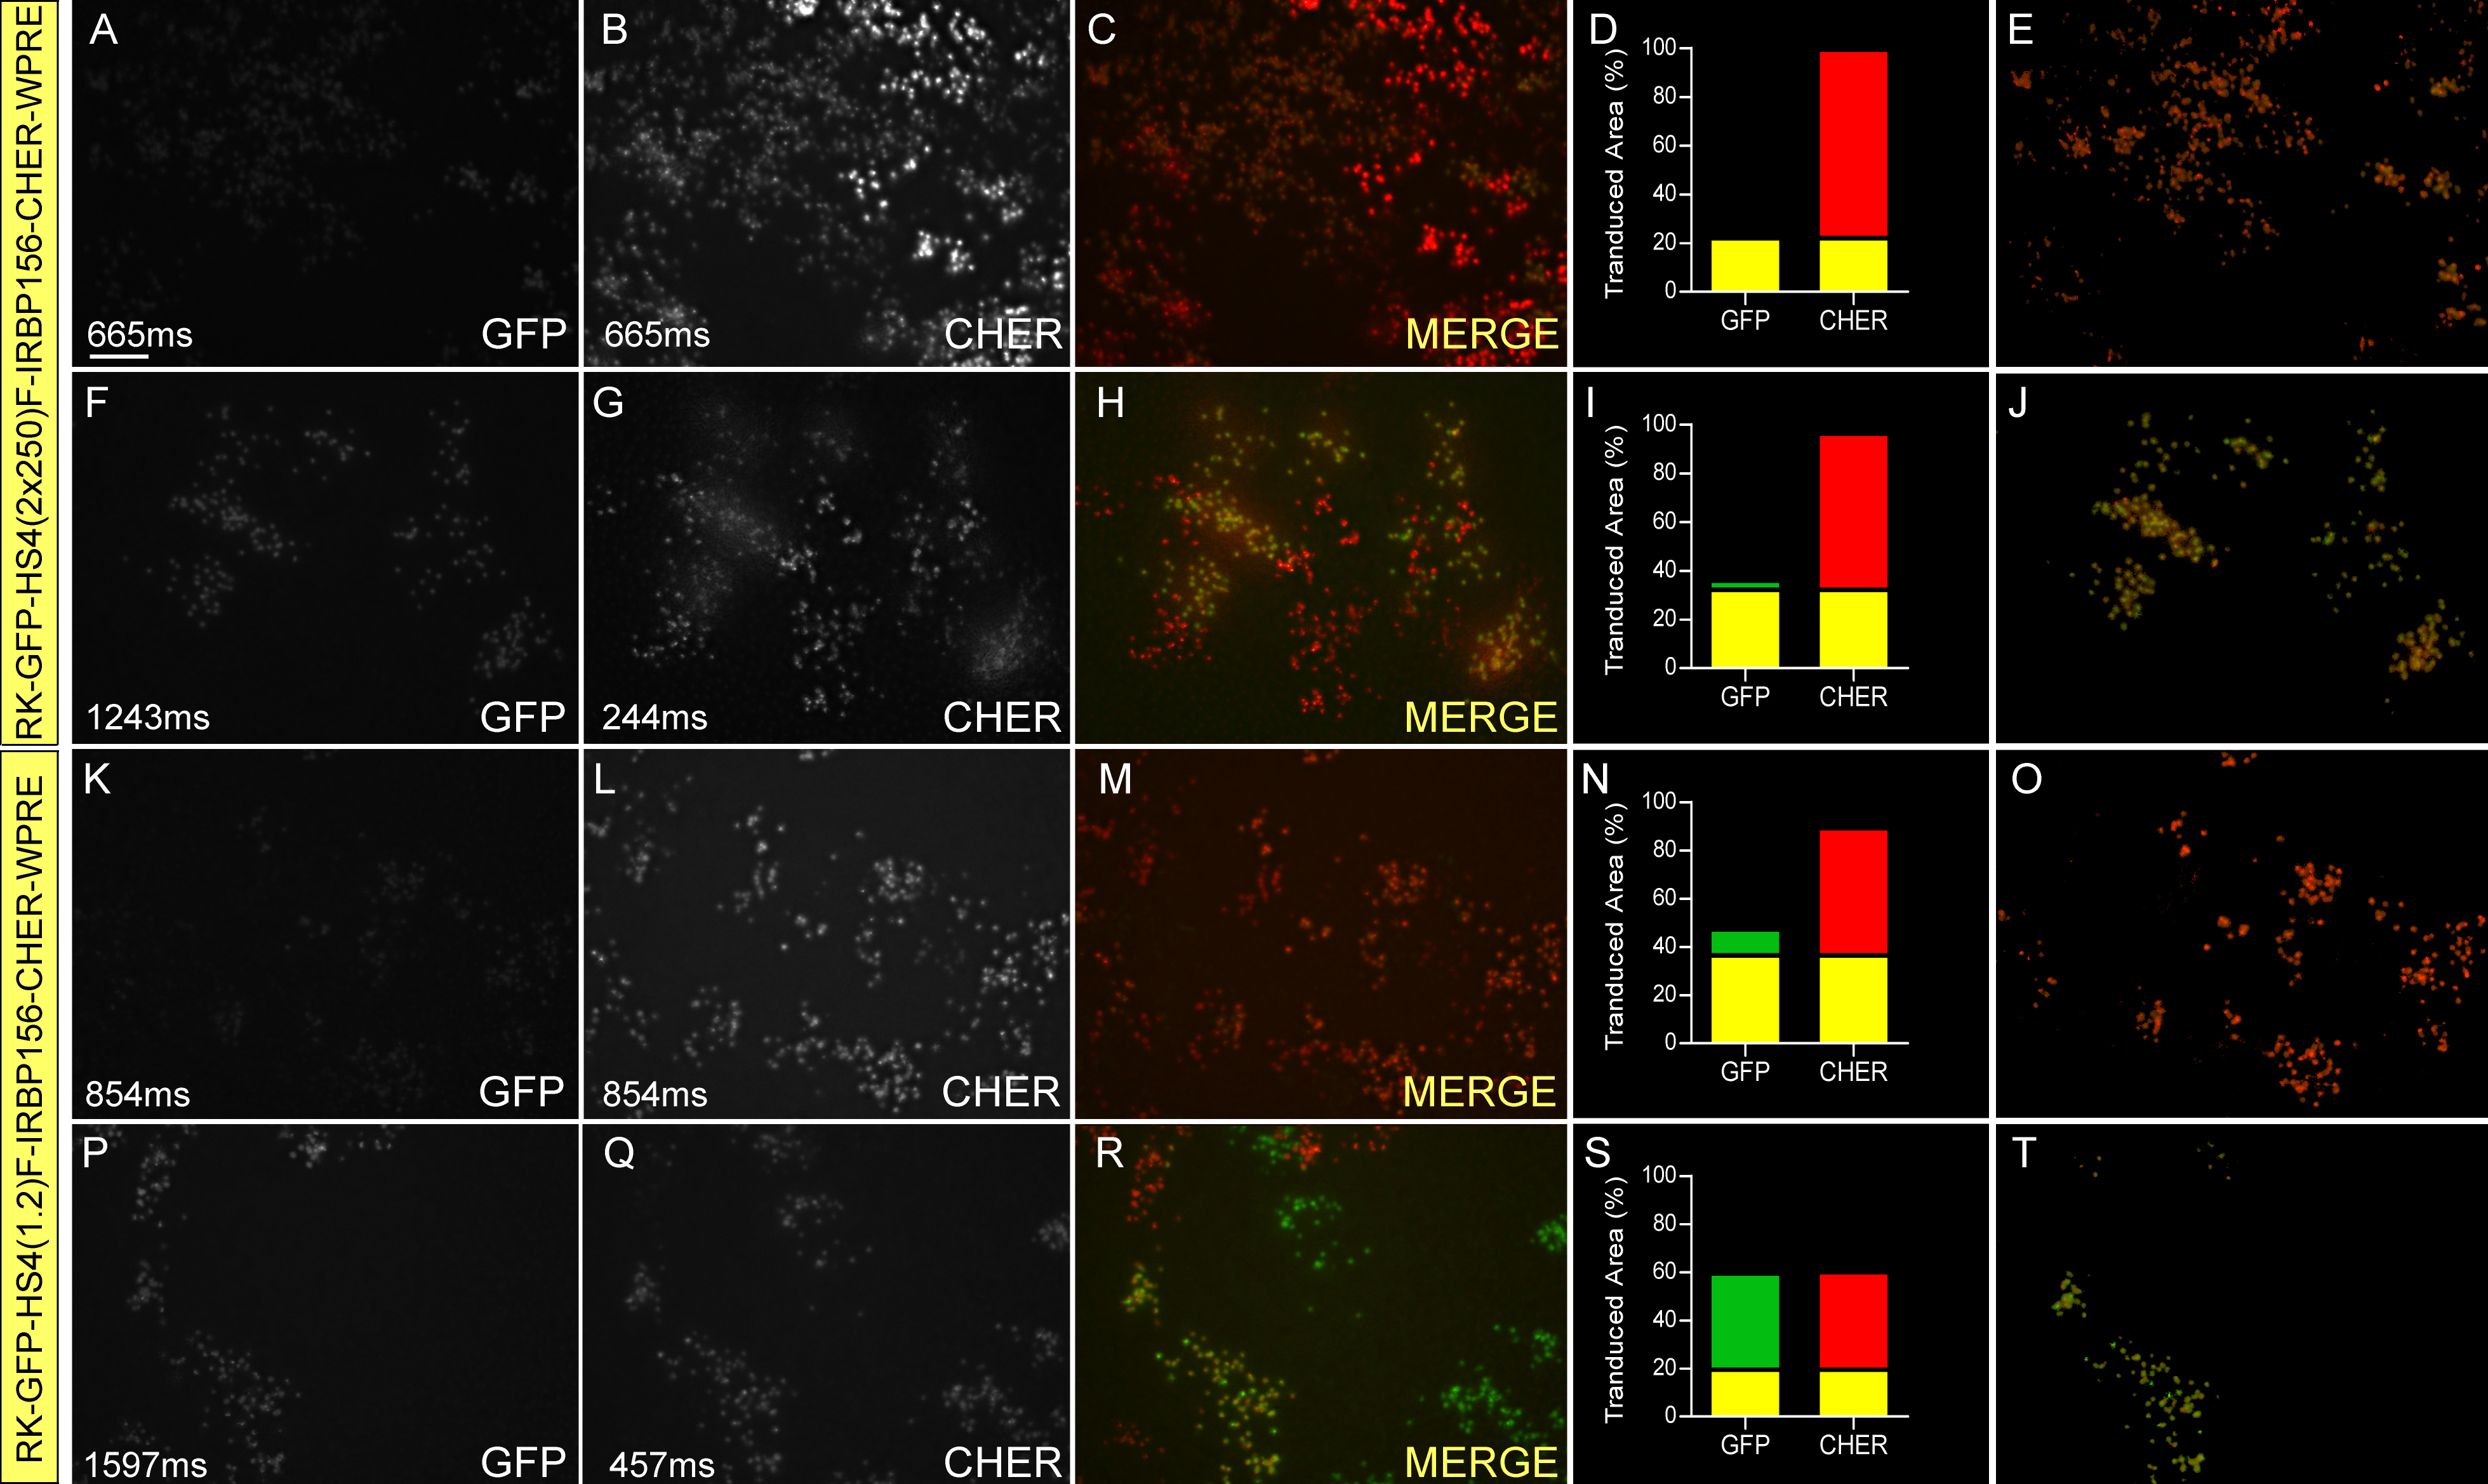
 Figure 7 of Semple-Rowland, Mol Vis 2010; 16:916-934.