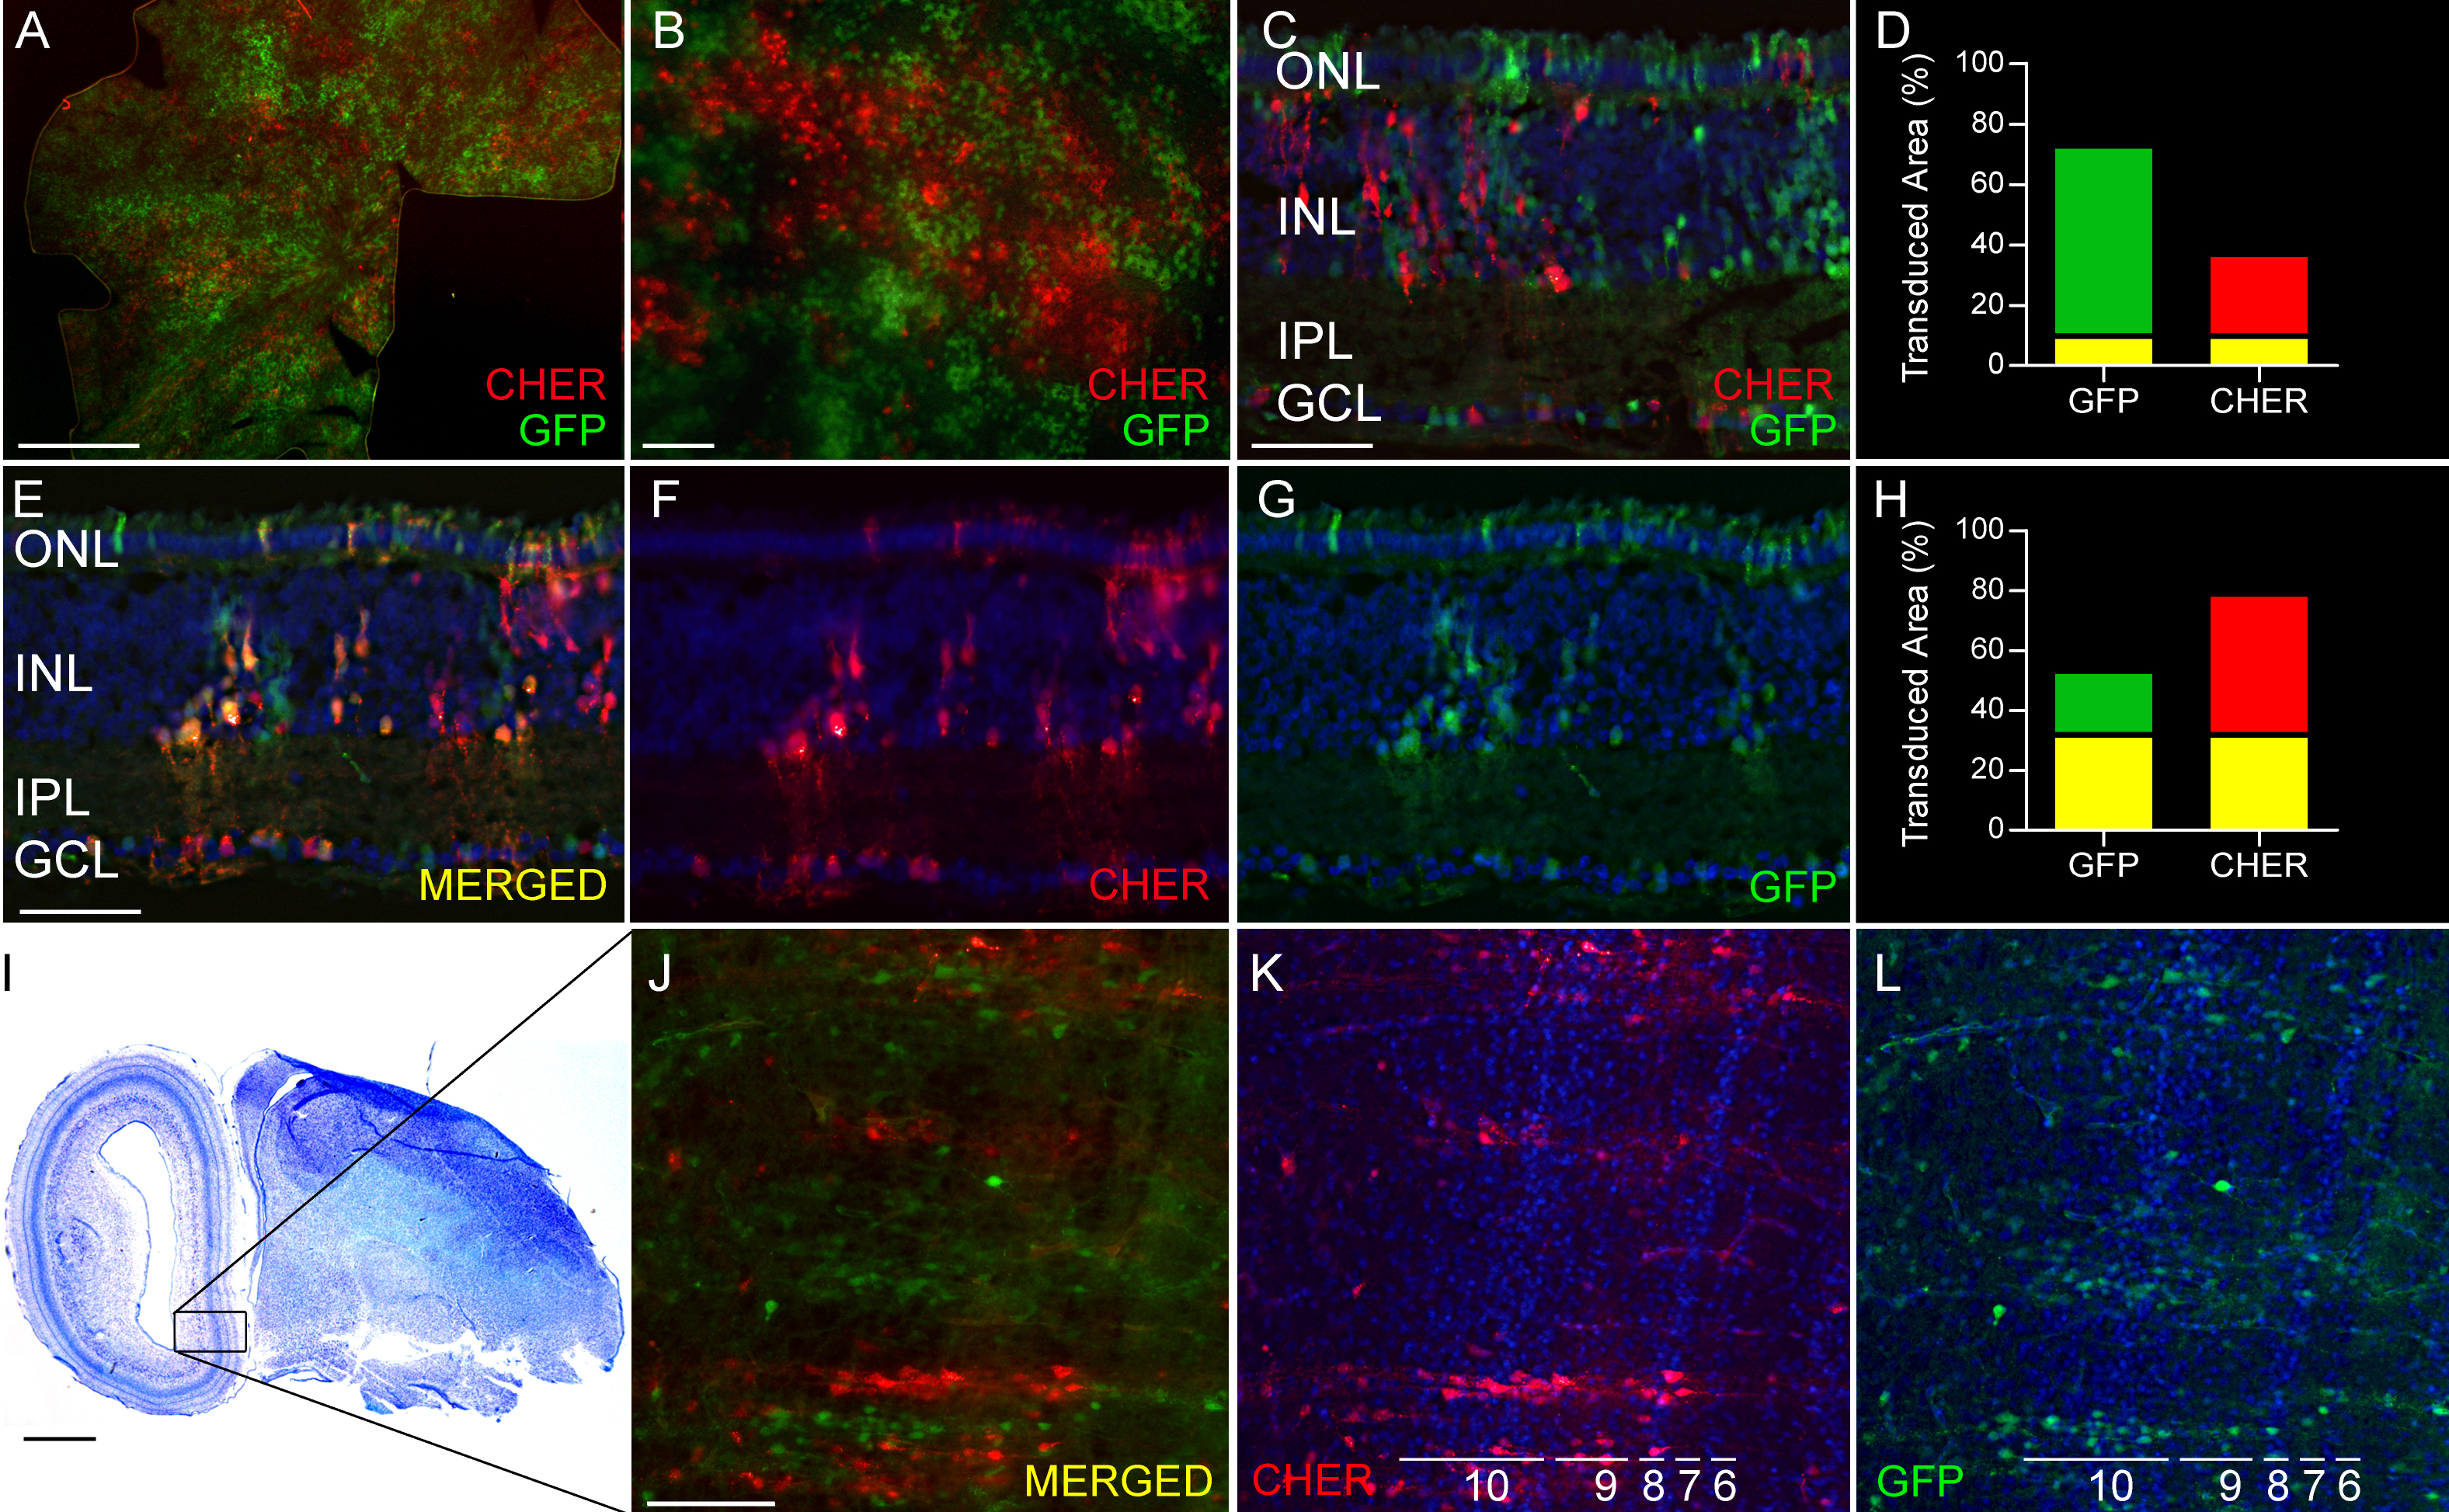
Figure 4. Expression of elongation factor
1a (EF1a) promoter-driven fluorescent proteins in retina and brain
transduced with a mixture of two lentiviruses. Equal volumes of two
lentiviral vectors, pFIN-EF1a-GFP-WPRE (2.4×10
10 vector
genomes/µl) and pFIN-EF1a-CHER-WPRE (4.6×10
9 vector
genomes/µl), were mixed and injected into the developing neural tubes
of E2 chicken embryos in ovo. The retinas and brains of the injected
embryos were harvested on E19-E20 and the cells expressing GFP and CHER
were identified using fluorescent microscopy.
A,
B These
retinal whole mounts, viewed from the photoreceptor side, show the
distribution of retinal cells expressing GFP and/or CHER fluorescent
protein(s). The scale bars in
A and
B equal 2000 and 50
µm, respectively.
C-D and
E-H: Sections of whole mounts
shown in A and B show that the EF1a promoter is active in cells
distributed throughout the neural retina.
C: This retinal
section, which contains very few transduced cells expressing both GFP
and CHER, was typical of most regions of the transduced retinas.
D:
The
image shown in C was analyzed using the co-localization module of
the Zeiss AxioVision Image Suite. The results of these analyses are
expressed as the percent of the transduced area in the image (pixels)
containing co-localized GFP and CHER (yellow bar) or GFP (green bar) or
CHER (red bar) fluorescence alone.
E-G: Image of retinal
section showing green (
E), red (
F) and merged (
G)
channels that contain several cells expressing both GFP and CHER.
H:
The
image shown in
E was analyzed using the co-localization
module of the Zeiss AxioVision Image Suite. The results of this
analysis are expressed as the percent of the transduced area in the
image (pixels) containing co-localized GFP and CHER (yellow bar) or GFP
(green bar) or CHER (red bar) fluorescence alone. The scale bars in C
and D equal 50 µm.
I: Thionin stained sagittal section of E20
chicken brain. Scale bar equals 1000 µm.
J-L: Fluorescent
images of GFP and CHER expression in optic tectum (the region shown in
F-F’’ corresponds to the boxed region in
I). The brain sections
were stained with a chicken anti-GFP antibody to enhance visualization
of the GFP expressing cells. Tectal layers are numbered according to
Cajal [
43]. Scale
bar in
J equals 100 µm. Retinal and brain sections shown in
C,
D-
G and
J-
L were counterstained with DAPI.
 Figure 4 of Semple-Rowland, Mol Vis 2010; 16:916-934.