Figure 4. Effect of p21+p16 siRNA on
p21Cip1 and p16INK4a protein expression 2 and 7 days following
treatment. HCEC from a 68-year-old donor were electroporated with
either control siRNA (+E/control siRNA) or p21+p16 siRNA (+E/p21+p16
siRNA). Western blots were used to analyze p21Cip1 (A) and
p16INK4a (B) protein levels at the 2 time-points. Results are
expressed relative to beta-actin. Note that both p21Cip1 and p16INK4a
were decreased to similar levels at both time points.
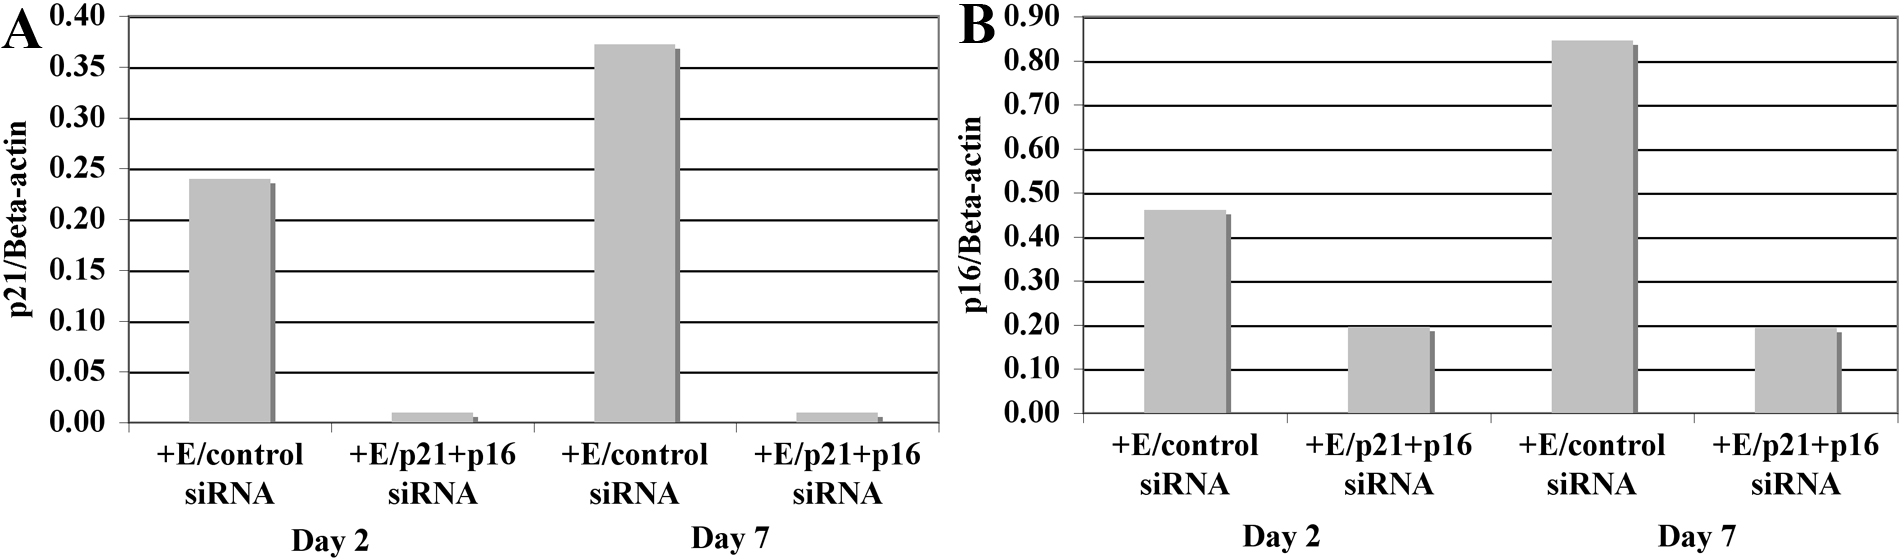
 Figure 4 of Joyce, Mol Vis 2010; 16:897-906.