Figure 3. Representative example of the
effect of treatment with p21+p16 siRNA on the protein levels of p21Cip1
and p16INK4a in HCEC cultured from a 71-year-old donor. A:
Densitometric analysis of the effect of p21+p16 siRNA treatment on
p21Cip1 protein expression in non-electroporated HCEC (-E/-siRNA), in
HCEC electroporated with Silencer negative control #1 siRNA (+E/control
siRNA), and in HCEC electroporated with p21+p16 siRNA (+E/p21+p16
siRNA). B: Western blots showing relative expression of p21Cip1
compared with beta-actin under each experimental condition. C:
Densitometric analysis of the effect of p21+p16 siRNA treatment on
p16INK4a protein expression under the same conditions as in A. D:
Western
blots
showing
relative
expression
of p16INK4a compared with
beta-actin under each experimental condition. Results in A and C
are expressed relative to beta-actin.
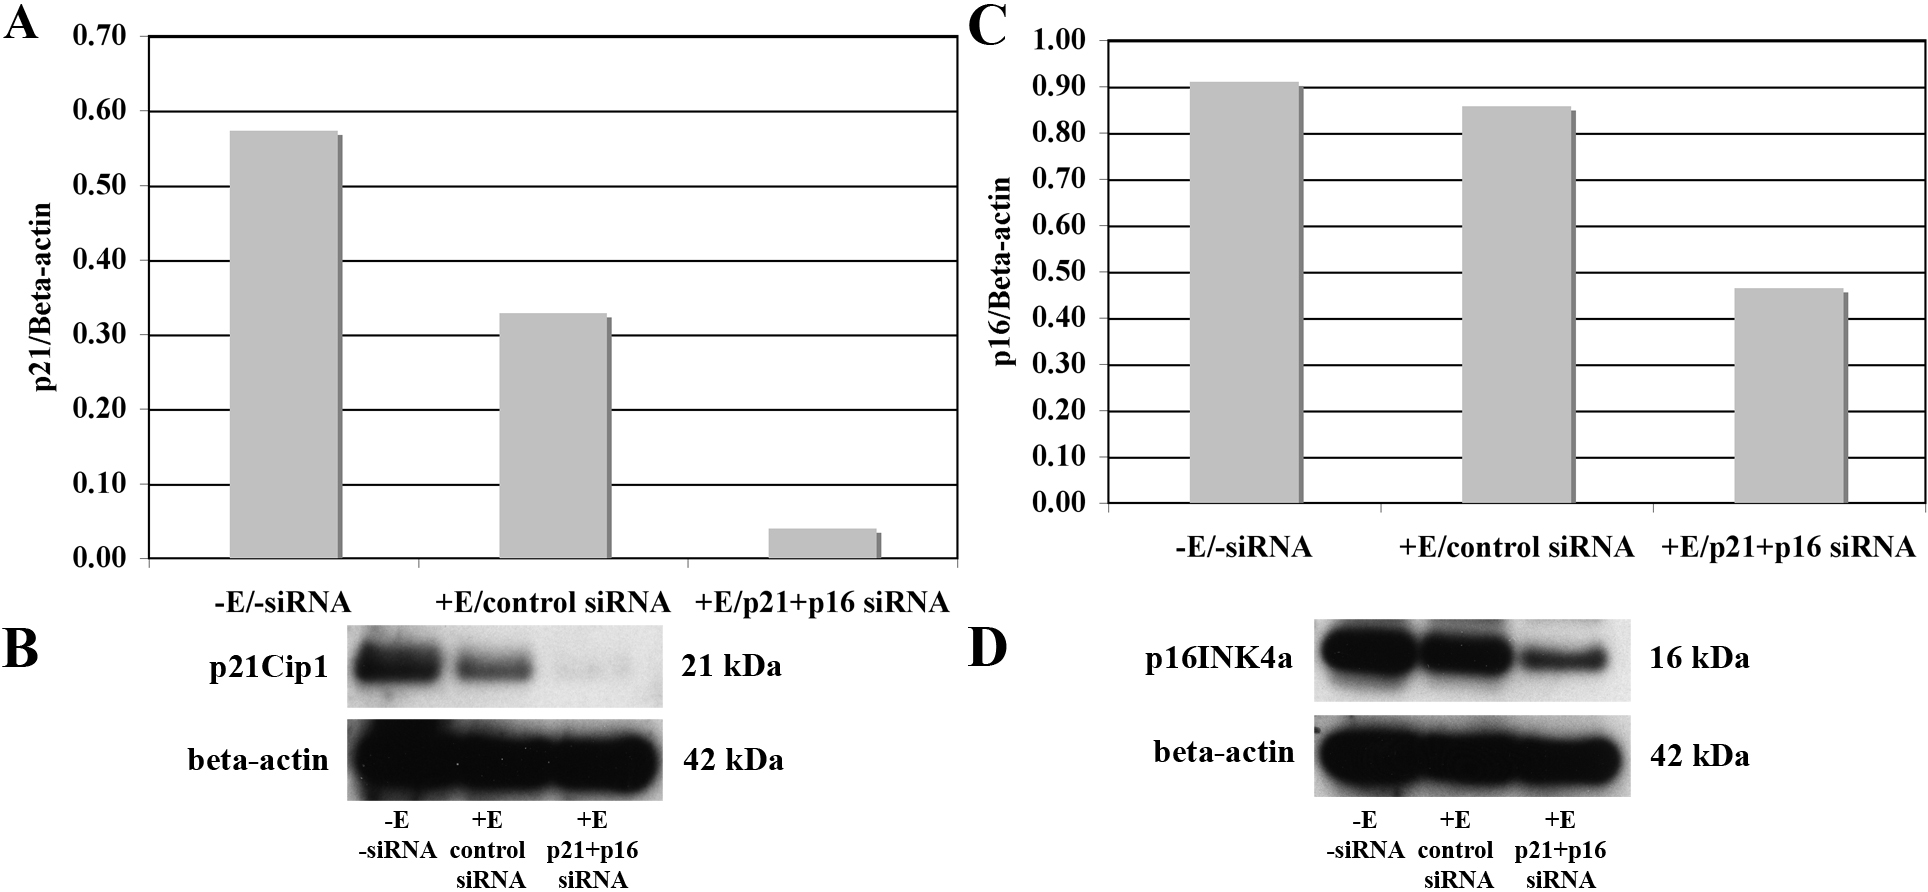
 Figure 3 of Joyce, Mol Vis 2010; 16:897-906.