Figure 2. Effect of treatment with 3
different p21 siRNAs on p21Cip1 and p16INK4a protein levels. The graph
of western blot results in (A) shows the effect of p21 siRNAs
s415, s416, and s417 on the protein level of p21Cip1. The graph in (B)
shows
the effect of the same 3 p21 siRNAs on the protein level of
p16INK4a. In the graphs, each bar shows the average relative expression
of p21Cip1 or p16INK4a (+/− SEM) in HCEC cultured from 3 older donors.
Beta-actin was used to normalize all results. Conditions included no
electroporation or siRNA treatment (-E/-siRNA), electroporation with
Silencer Cy3-labeled Negative Control #1 siRNA (+E/Cy3control), and
electroporation with each of three siRNAs (+E/p21 s415, s416, or s417).
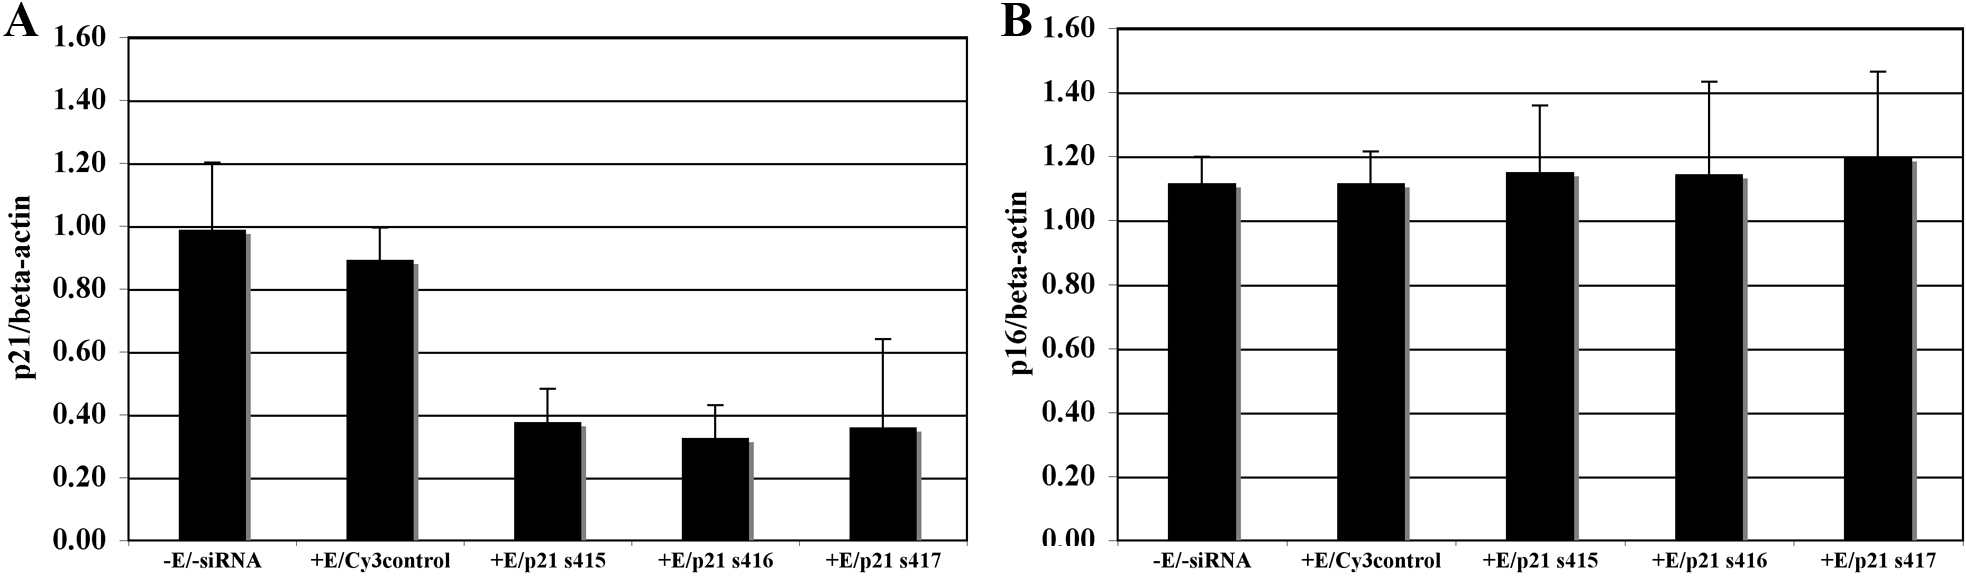
 Figure 2 of Joyce, Mol Vis 2010; 16:897-906.