Figure 3. Serum levels of proinflammatory
cytokines are expressed in pg/ml, relative to time interval from CRAO
induction. The square-interspersed line indicates the control level in
naìve mice. The triangle-interspersed line indicates the control level
in rose-bengal-injected mice. Error bars represent SD. The asterisk
indicates statistical significance. The specific values are detailed
for each cytokine separately. A: MIP-2 Levels were elevated at
1 h. The level at 1 h was statistically significantly higher than
levels thereafter (p=0.03). B: IL-6 levels increased at 3 h and
remained elevated at 6 h and 12 h. The elevated levels were
statistically significantly higher than levels of both control groups
(p=0.02, 0.03 and 0.003 for 3 h, 6 h, and 12 h, respectively). C:
TNF-α showed an early peak at 1h and late elevation at 1week and 3
weeks. Statistical significance was found only between the early peak
and the control levels of rose bengal injected mice.
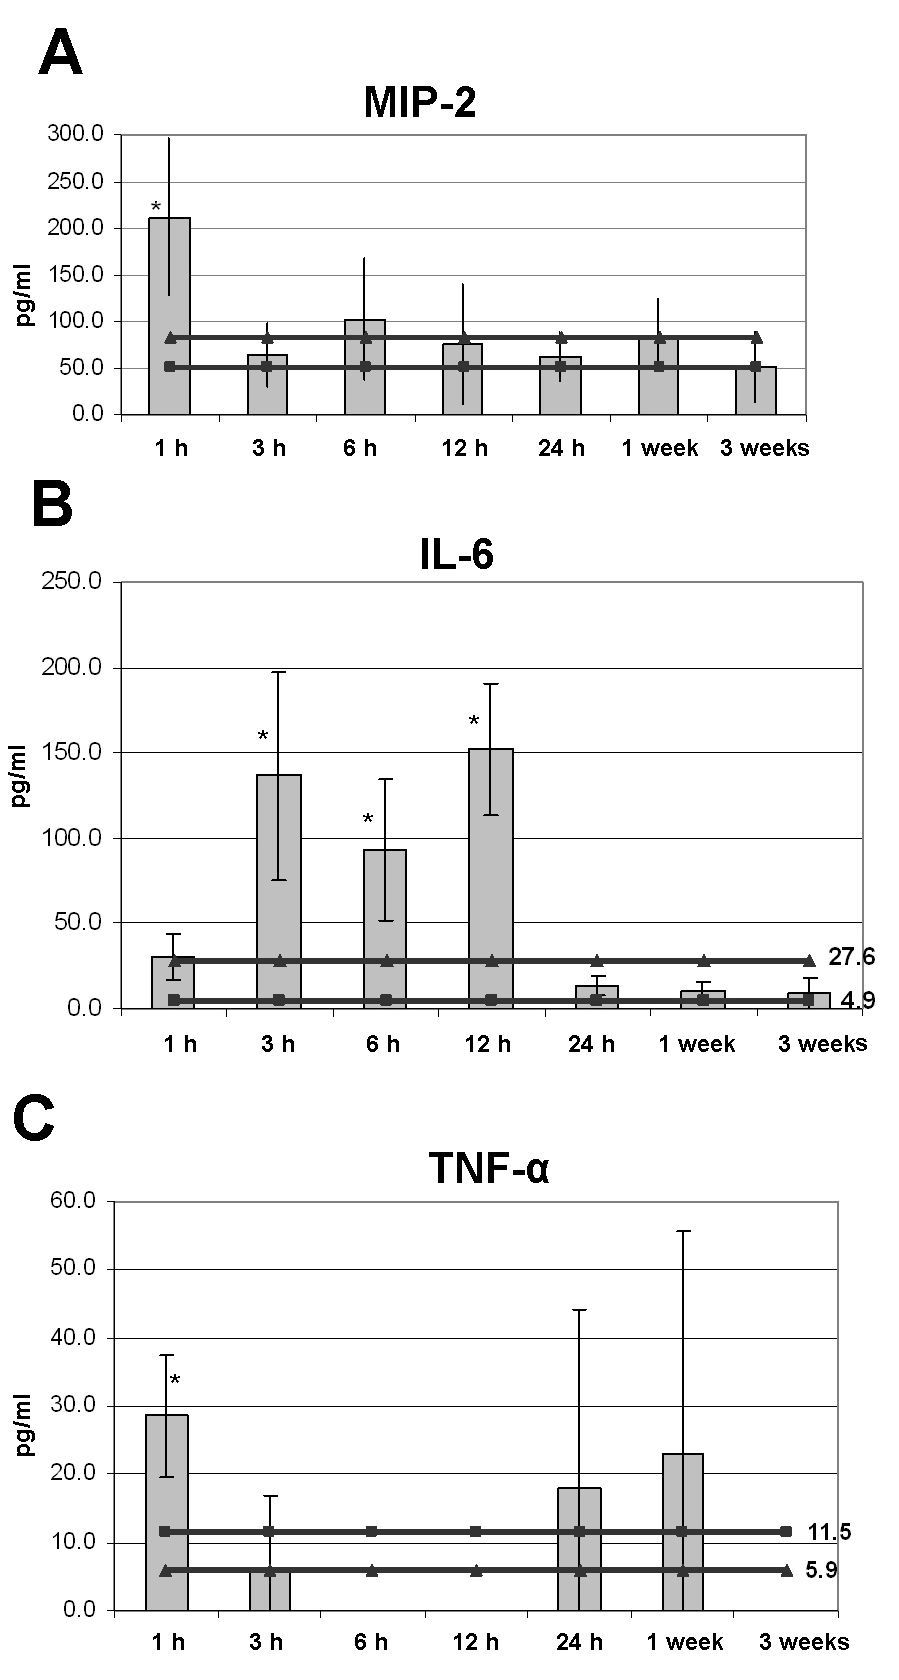
 Figure 3 of Kramer, Mol Vis 2009; 15:885-894.