Figure 2. Western blot analysis of cytokines in retinal samples at different time points. Western blot analysis of the cytokines in
pooled retinal samples, using goat anti–rat antibodies. Recombinant proteins were used for each cytokine as positive control.
The proteins were separated using SDS–PAGE. Labeling was performed using donkey anti goat IgG HRP conjugated antibody. Films
were developed using ECL reagent. A: Western blot analysis demonstrated the presence of TNF-α at all time points measured with high intensity bands at both 3
h and 12 h. A slight decrease occurred at 7 days. B: Western blot analysis of IL-6 demonstrated the presence of the cytokine in the retina at 3 h. Band intensity increased at
12 h, and was hardly visible at 7 days. C: Western blot analysis of MIP-2 demonstrated the presence of the cytokine in all studied samples. MIP-2 was evident at 3 h,
with maximal band intensity at 12 h, and hardly visible at 7 days. PC represents positive control.
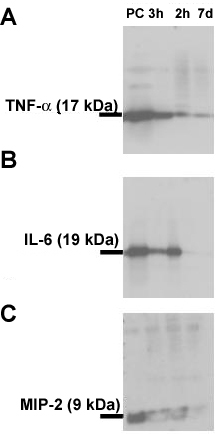
 Figure 2 of
Kramer, Mol Vis 2009; 15:885-894.
Figure 2 of
Kramer, Mol Vis 2009; 15:885-894.