Figure 1. Relative mRNA expression of
proinflammatory cytokines in ischemic eyes compared to control eyes at
variable time intervals from CRAO induction. A: Elevated levels
of MIP-2 at 12 h and 24 h are statistically significantly
higher than the levels at 3 h and 7 days (p<0.01). Light bar in
the 3 h column represents total mean value, and the dark bar represents
the trend of reduced expression. The bars at 12 h, 24 h, and 7 days
display the mean values which represent the trends as well. B:
Levels of IL-6 peaked at 12 h and 24 h. The differences between
levels at 3 h and 12 h, as well as between 3 h and 24 h were
statistically significant (p<0.01, 0.02, respectively). Levels at 7
days were statistically significantly lower than levels at 24 h
(p<0.01). Light bar in the 3 h column represents total mean
value, and the dark bar represents the trend of reduced expression. The
bars at 12 h, 24 h, and 7 days display the mean values which represent
the trends as well. C: Level of expression of TNF-α at
24 h was statistically significantly different from expression at 7
days (p=0.033). The asterisk indicates statistical significance. Error
bars represent SD.
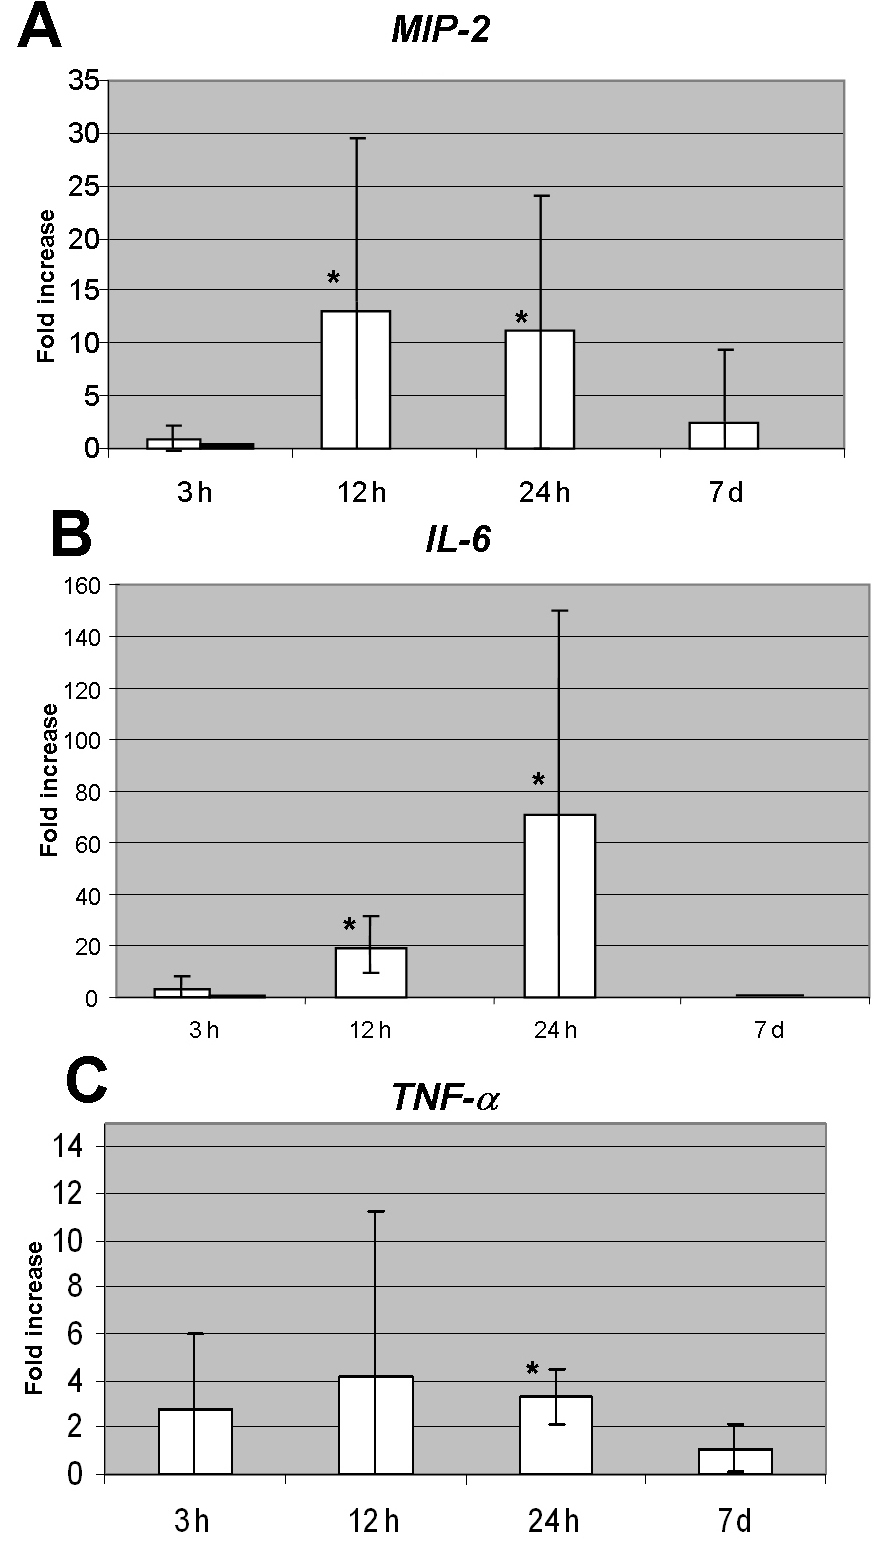
 Figure 1 of Kramer, Mol Vis 2009; 15:885-894.