Figure 6. Sequence analysis of L and M
opsin genes in Family 3. Reference sequences of the L and M genes are
shown on top of the electropherograms generated from an affected male
(4.2) in Family 3. Nucleotides marked with an arrow indicate known
differences between the L and M genes or a patient mutation. A
shows sequence 5′ to the start codon (capitals) of exon 1. Note
presence of single sequence peaks at positions of known nucleotide
variation between L and M opsin sequences (arrows), indicating absence
of M exon 1. B shows exon 2 sequence with single peaks
representing the presence of L nucleotides but absence of M nucleotides
at sites of known variation between L and M opsin genes. C
shows exon 3 sequence in which M exon 3 only is present. D
shows exon 4 sequence in which only M exon 4 sequence is present. E
shows exon 4 sequence with a T>C nucleotide substitution (arrow)
resulting in C203R missense mutation.
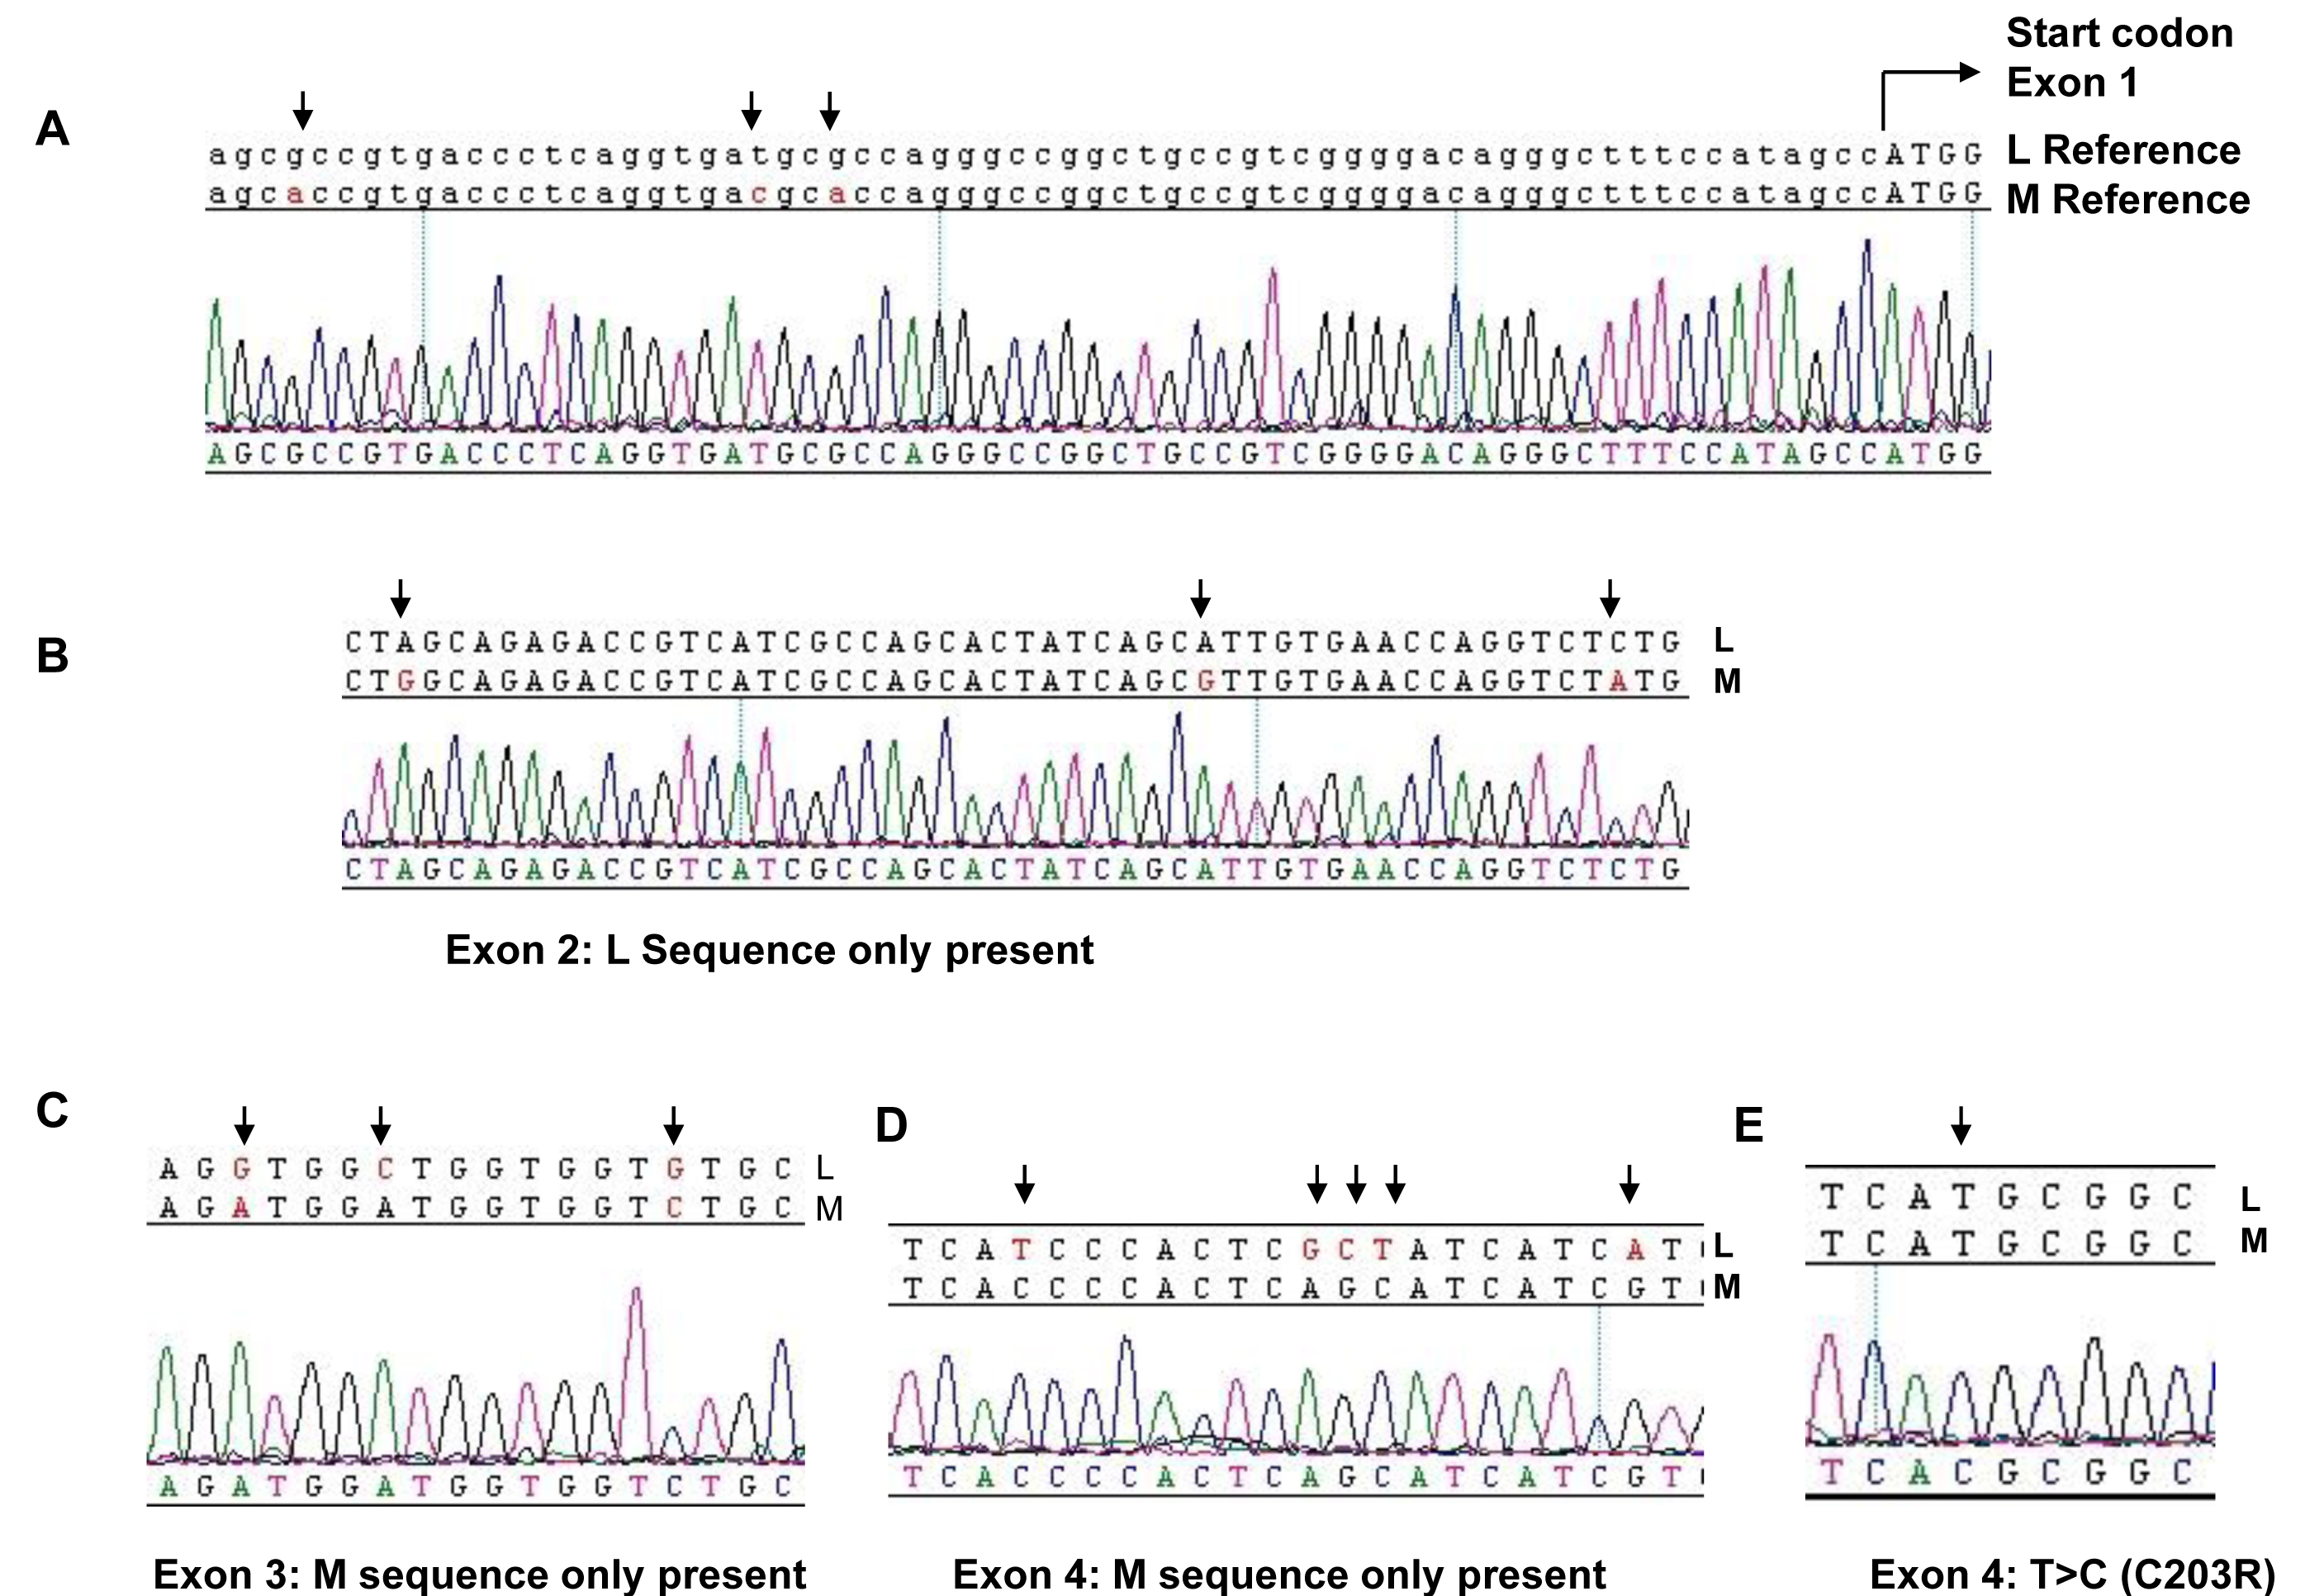
 Figure 6 of Gardner, Mol Vis 2009; 15:876-884.