Figure 4. Sequence analysis of L and M
opsin genes in Family 2. Reference sequences of the L and M genes are
shown on top of the electropherograms, which were generated from an
affected male (individual 1.1) in Family 2. Nucleotides marked with an
arrow indicate known differences between the L and M genes. A
shows opsin sequence beginning 5′ to the start codon (capital letters)
of exon 1. Note the presence of single sequence peaks at positions of
known nucleotide variation between L and M gene sequences (arrows),
indicating the absence of M exon 1. B shows Exon 3 sequence
with single peaks at sites of known variation between L and M opsin
gene sequences (arrows) representing the presence of M exon 3
nucleotides and absence of L exon 3 nucleotides. Similarly, absence of
an L sequence was noted for exons 4 and 5 (data not shown).
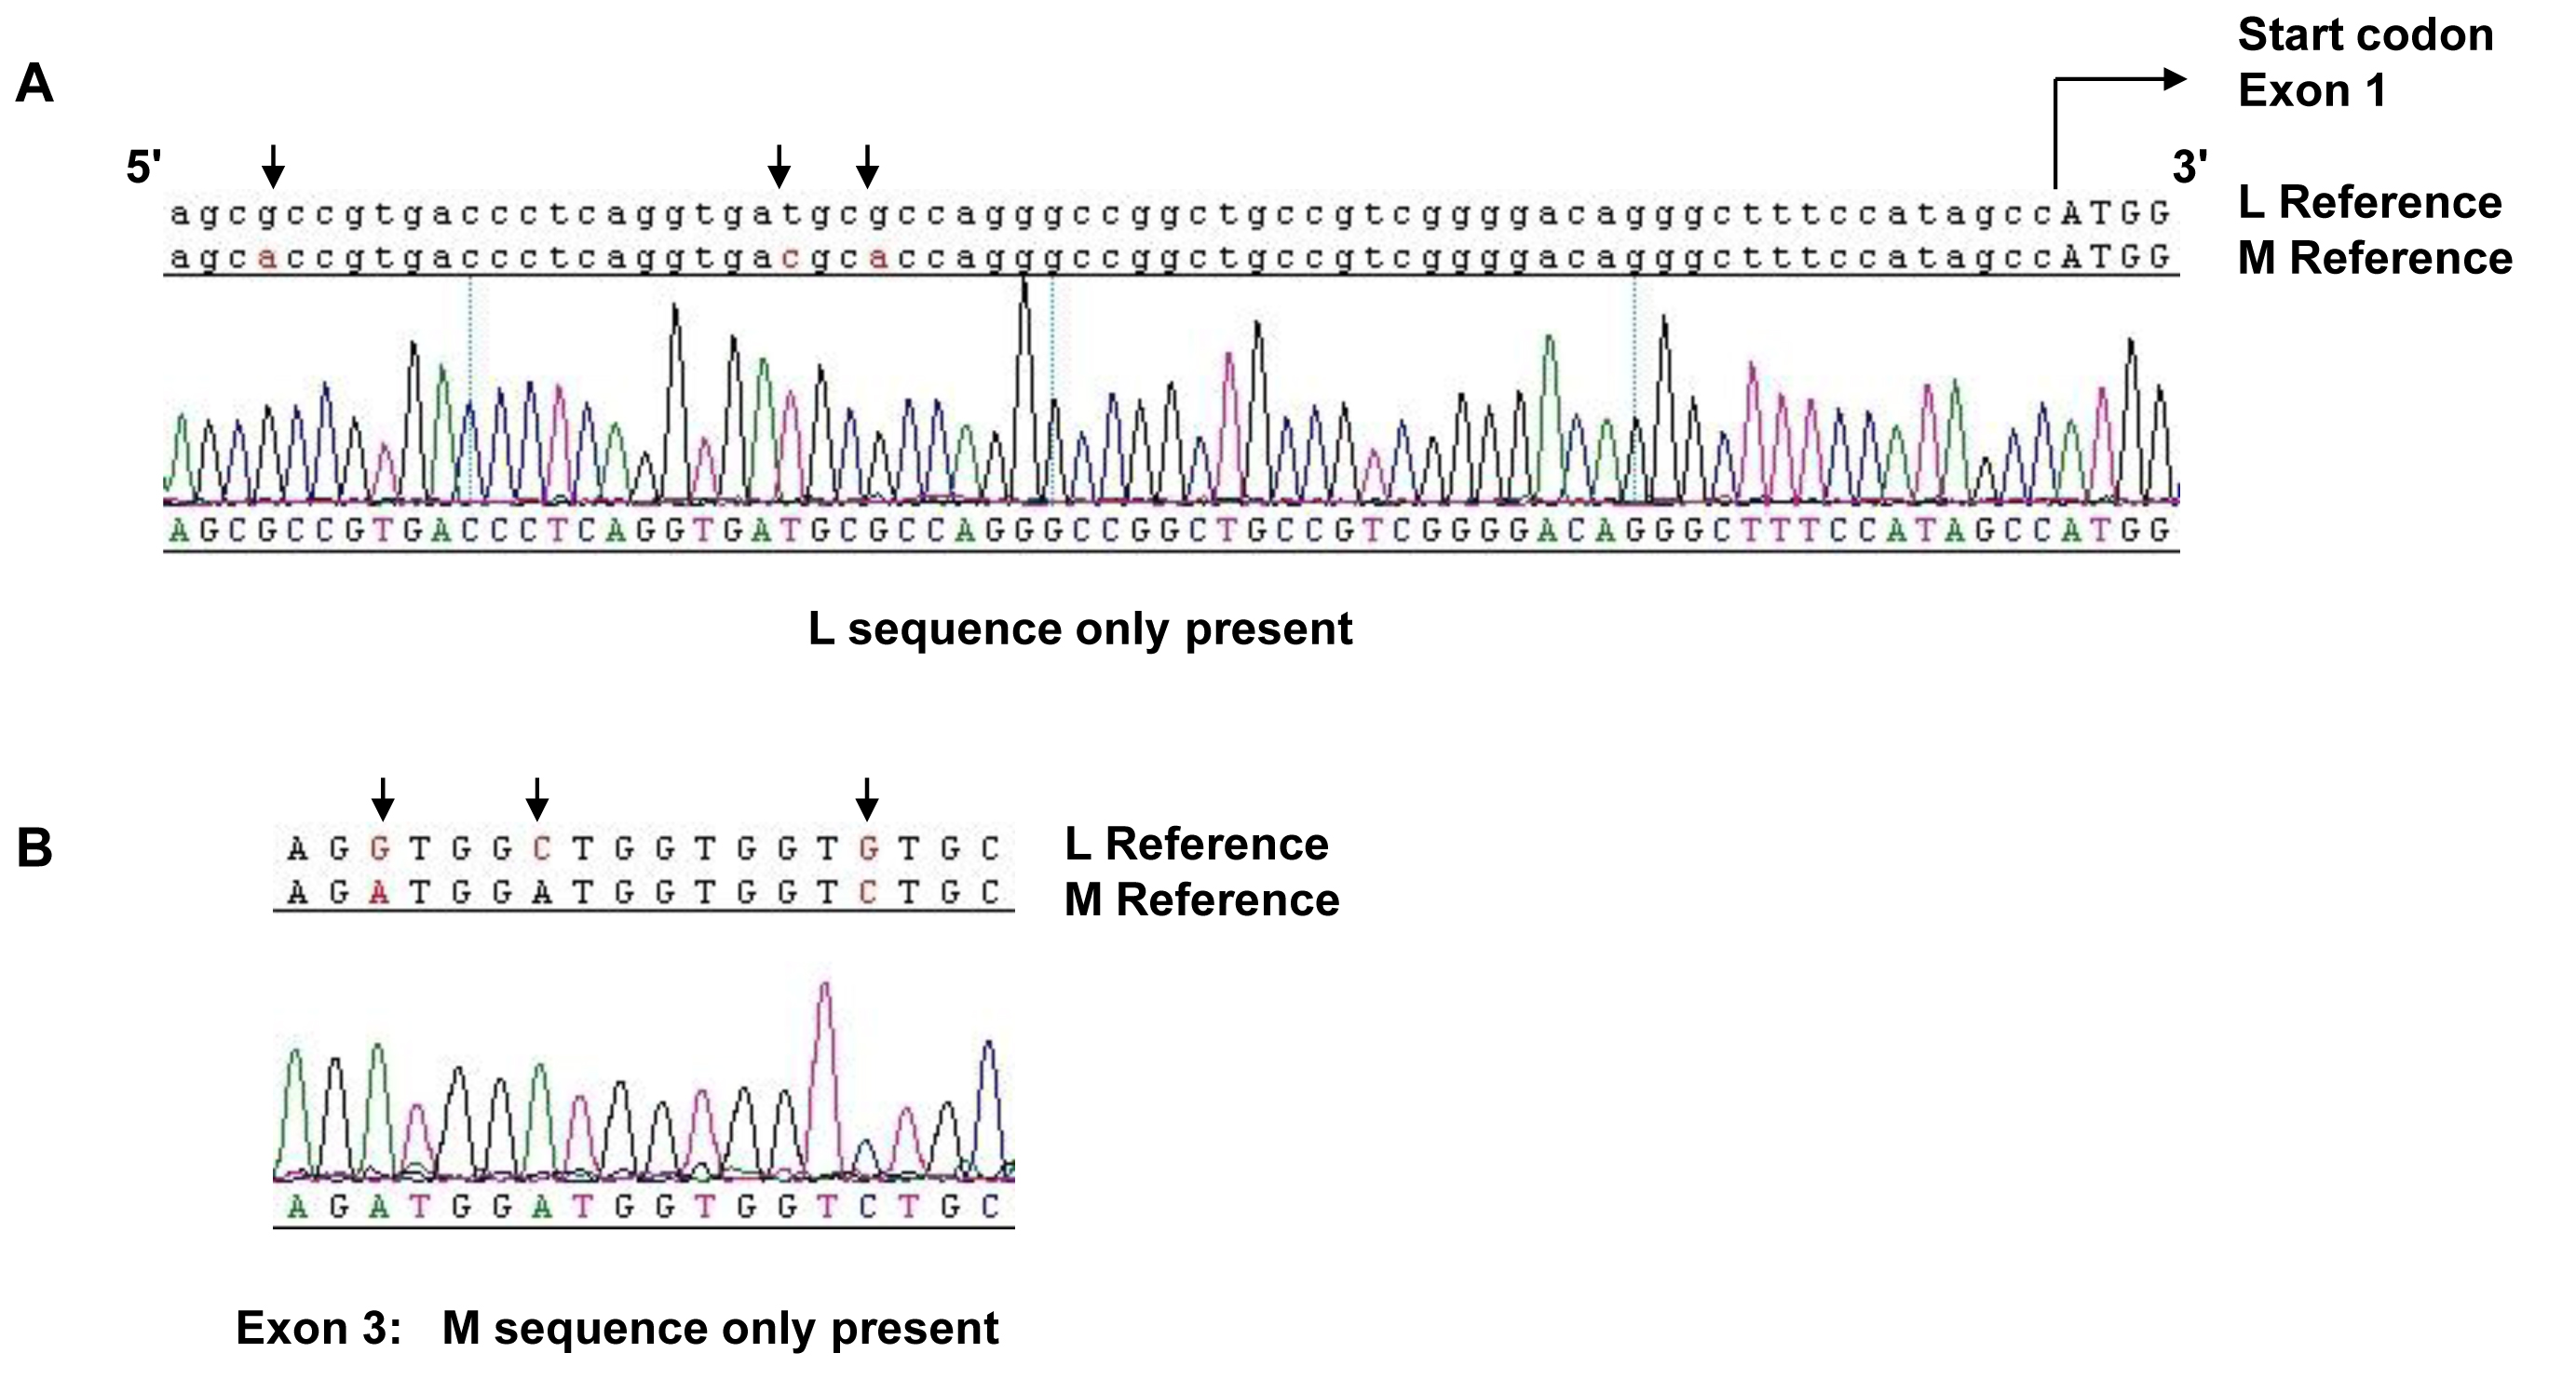
 Figure 4 of Gardner, Mol Vis 2009; 15:876-884.