Figure 2. Sequence analysis of L and M
opsin genes in Family 1. Sequence from an affected male (2.1) was
generated with primers designed to coamplify both L and M genes.
Reference sequences of the L and M genes are shown on top of the
patient electropherograms. Nucleotides marked with an arrow indicate
known differences between the L and M genes or a patient mutation. A
shows electropherogram sequence in the region of exon 1 5′ to the start
codon (indicated by capital letters). Note the double peaks (denoted N)
at positions of sequence variation between L and M genes (arrows),
indicating the presence of both L and M exon 1. B shows
sequence from Exon 3. Single peaks at positions of known nucleotide
variation (arrows) between the L and M genes indicate only L opsin exon
3 is present. C shows an electropherogram from Exon 4 which
indicates M exon 4 sequence only is present. D shows a section
of Exon 4 in which a T>C nucleotide substitution (arrow) is present
that results in a C203R missense mutation.
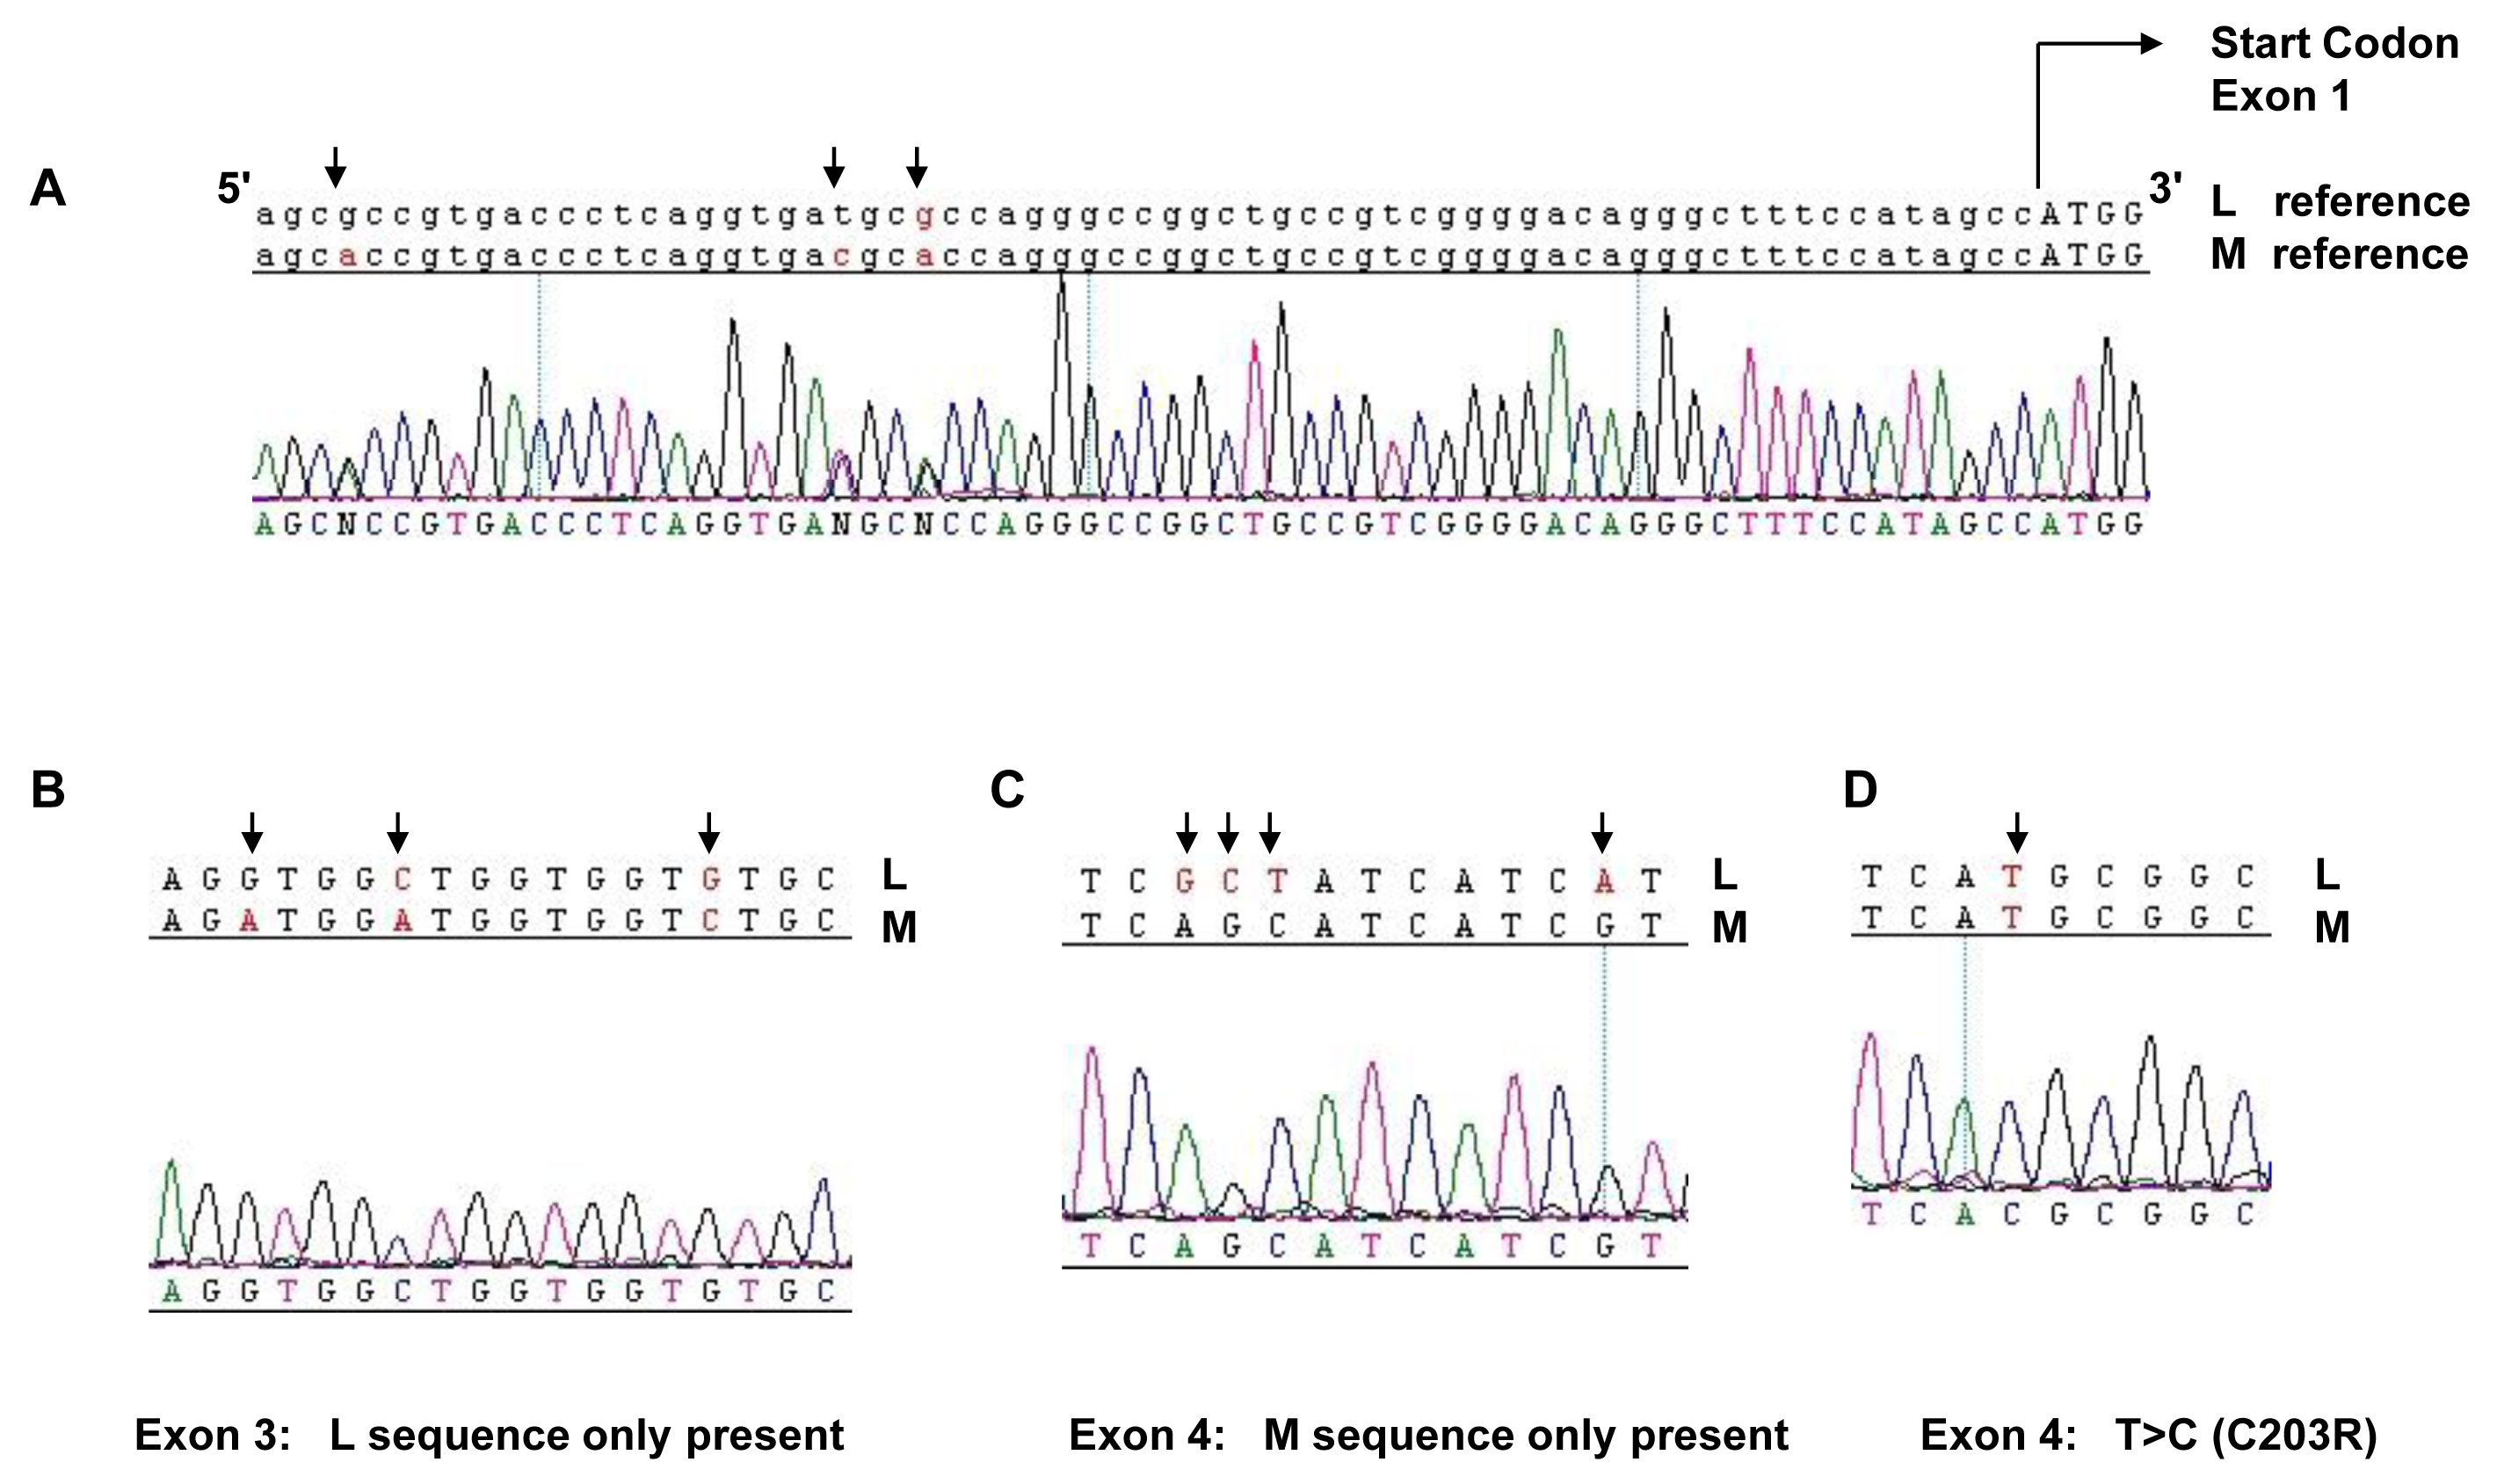
 Figure 2 of Gardner, Mol Vis 2009; 15:876-884.