Figure 6. Pro370Leu mutant myocilin further decreases mitochondrial membrane potential in TM cells. ΔΨm was examined using flow cytometry
with the fluorescence indicator, JC-1. The dye fluoresces red when aggregates in healthy mitochondria with high membrane potential,
whereas it appears in monomeric form and fluoresces green in mitochondria with diminished membrane potential. The cells number
in the Q4 area (green fluorescence) indicates the number of cells with low ΔΨm. The histogram shows the relative decrease
of ΔΨm to the non-transfected cell (Control). A: The ΔΨm is 3.03 fold (±0.90) lower in TM cells transfected with Pro370Leu mutant myocilin (P370L) compared to TM cells transfected
with WT myocilin (WT) while there is a 2.44 fold (±0.87) reduction in WT compared to Mock. B: Pro370Leu mutant myocilin transfected TM cells have a significantly lower red to green ratio, and more cells show green
fluorescence (cells in Q4 area), indicating Pro370leu mutant myocilin causes a greater mitochondria membrane depolarization.
Results are expressed as the mean fold decrease in relative aggregate, a monomer (red:green) ratio of transfected TM to non-transfected
TM cells. The error bars represent SE of three repeated experiments done in triplicate. An asterisk indicates a significant
difference from non-transfected cells at p<0.05.
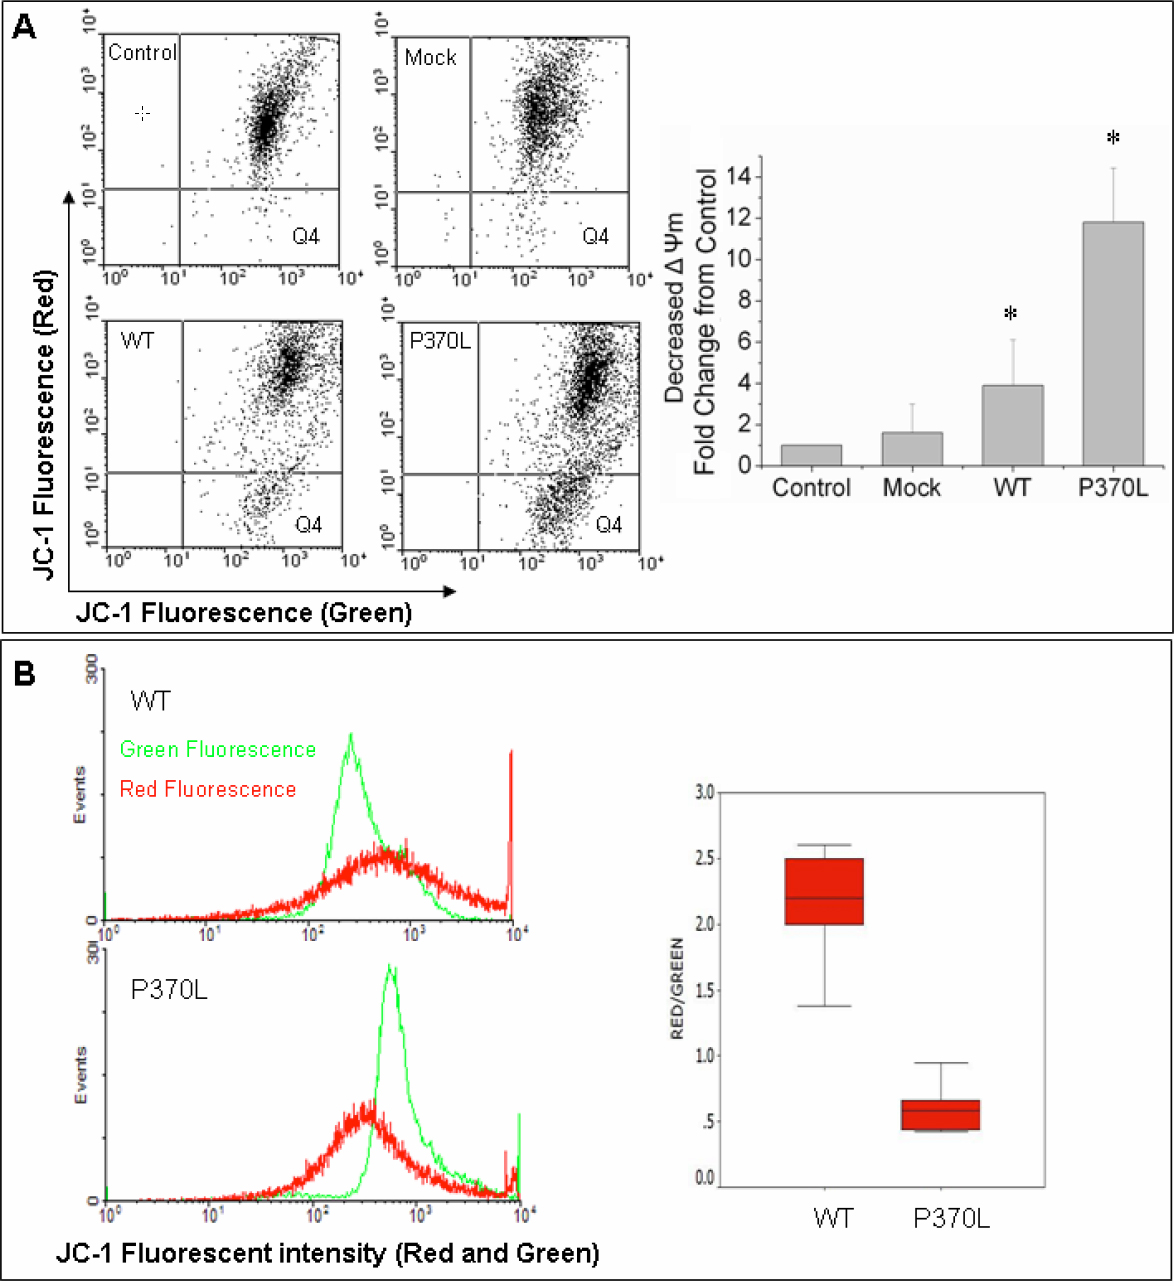
 Figure 6 of
He, Mol Vis 2009; 15:815-825.
Figure 6 of
He, Mol Vis 2009; 15:815-825.