Figure 2. SPR sensorgrams of endostatin interactions with ECM components. Endostatin variants (wild type, mutant p.A1381T) were diluted
to a concentration series in 0.02 M Tris-HCl, 0.11 M NaCl containing 0.05% P-20, and then injected into the sensor chips immobilized
with laminin-1-nidogen-1 complex (A=wt, B=p.A1381T), fibulin (C=wt, D=p.A1381T), and perlecan (E=wt, F=p.A1381T) at 25 °C with a flow rate of 20 μl/min. Sensorgrams show binding of various concentrations of endostatin to the
coated sensor surfaces. The association curves were monitored for 3 min, and the dissociation phases were recorded for 10
min but presented for 5 min. All the kinetics studies were performed three times independently at concentrations of 0–400
nM, and the data were analyzed with BIAevaluation software version 3.1 using the 1:1 Langmuir binding model.
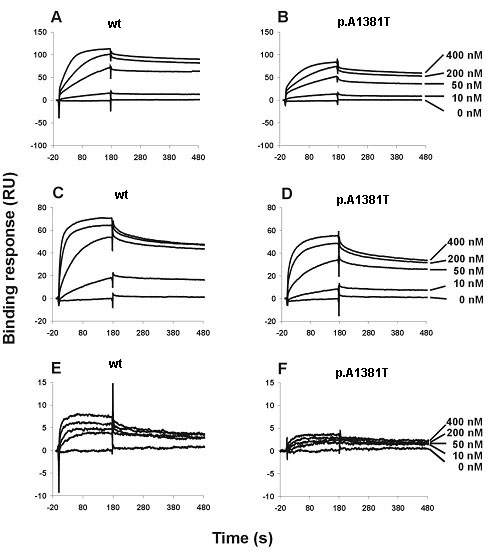
 Figure 2 of
Suzuki, Mol Vis 2009; 15:801-809.
Figure 2 of
Suzuki, Mol Vis 2009; 15:801-809.