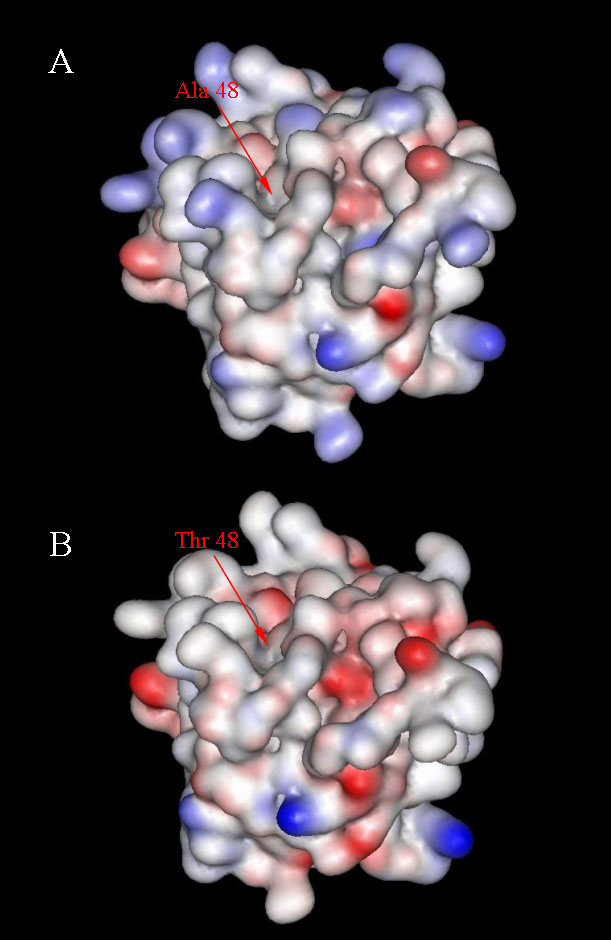
Figure 1. Molecular modeling of wild type and p.A1381T endostatins. Analysis of the electrostatic surface of wild type (
A) and p.A1381T (
B) endostatins. Areas shown in red represent a negative potential while the blue areas are positive. The position 48 of the
endostatin domain (Protein Data Bank entry 1BNL) corresponds to the position 1381 of the NC11–493 isoform (
GenBank AF018081.1).
 Figure 1 of
Suzuki, Mol Vis 2009; 15:801-809.
Figure 1 of
Suzuki, Mol Vis 2009; 15:801-809.