Figure 7. ATH protein accumulation in
posterior chick ocular tissues from eyes in various growth states.
Retina–RPE, choroid, sclera, and suprachoroidal fluid were harvested
from the posterior poles of 10-day-old untreated, normal eyes (N),
following 10 days of form deprivation (FD), and following 1, 4, and 7
days of unrestricted vision with prior form deprivation for 10 days (1
day, 4 day, and 7 day recovery, respectively) together with tissues
from contralateral control eyes. Total protein (8 μg) from each tissue
extract was separated by SDS–PAGE, and ATH protein expression was
detected by western blot analysis. The 11.5 kDa band from each
sample was quantified by densitometry using NIH Image v. 1.63. Bars
represent the integrated optical density (IOD) of ATH bands on western
blots from treated eyes minus IOD of contralateral controls (mean±SEM).
A: ATH protein expression was measured in the posterior
retina/RPE. B: ATH protein expression was measured in the
posterior choroid. A large increase in ATH was detected in choroids
following 4 days of recovery as compared with ATH levels in choroids of
contralateral controls. C: ATH protein expression was measured
in the posterior sclera. D: ATH protein accumulation was
measured in aliquots of suprachoroidal fluid isolated from the
posterior poles of enucleated eyes. E: ATH protein expression
was measured in choroids following 4 days of recovery and in
contralateral control eyes (n=6 additional pairs of control and treated
eyes). F: Representative western blots are shown of ATH protein
in retina/RPE (Ret), choroid (Chor), sclera (Scl), and suprachoroidal
fluid (Supra) in treated (R) and control (C) eyes following 4 days of
recovery. Data represent the mean±SEM for n=3 birds (3 pairs of control
and treated eyes for figures A-D and n=6 pairs for figure E)
in each group *p<0.05. Comparisons between recovering and
contralateral control eyes were made using the Wilcoxon signed-rank
test for paired data.
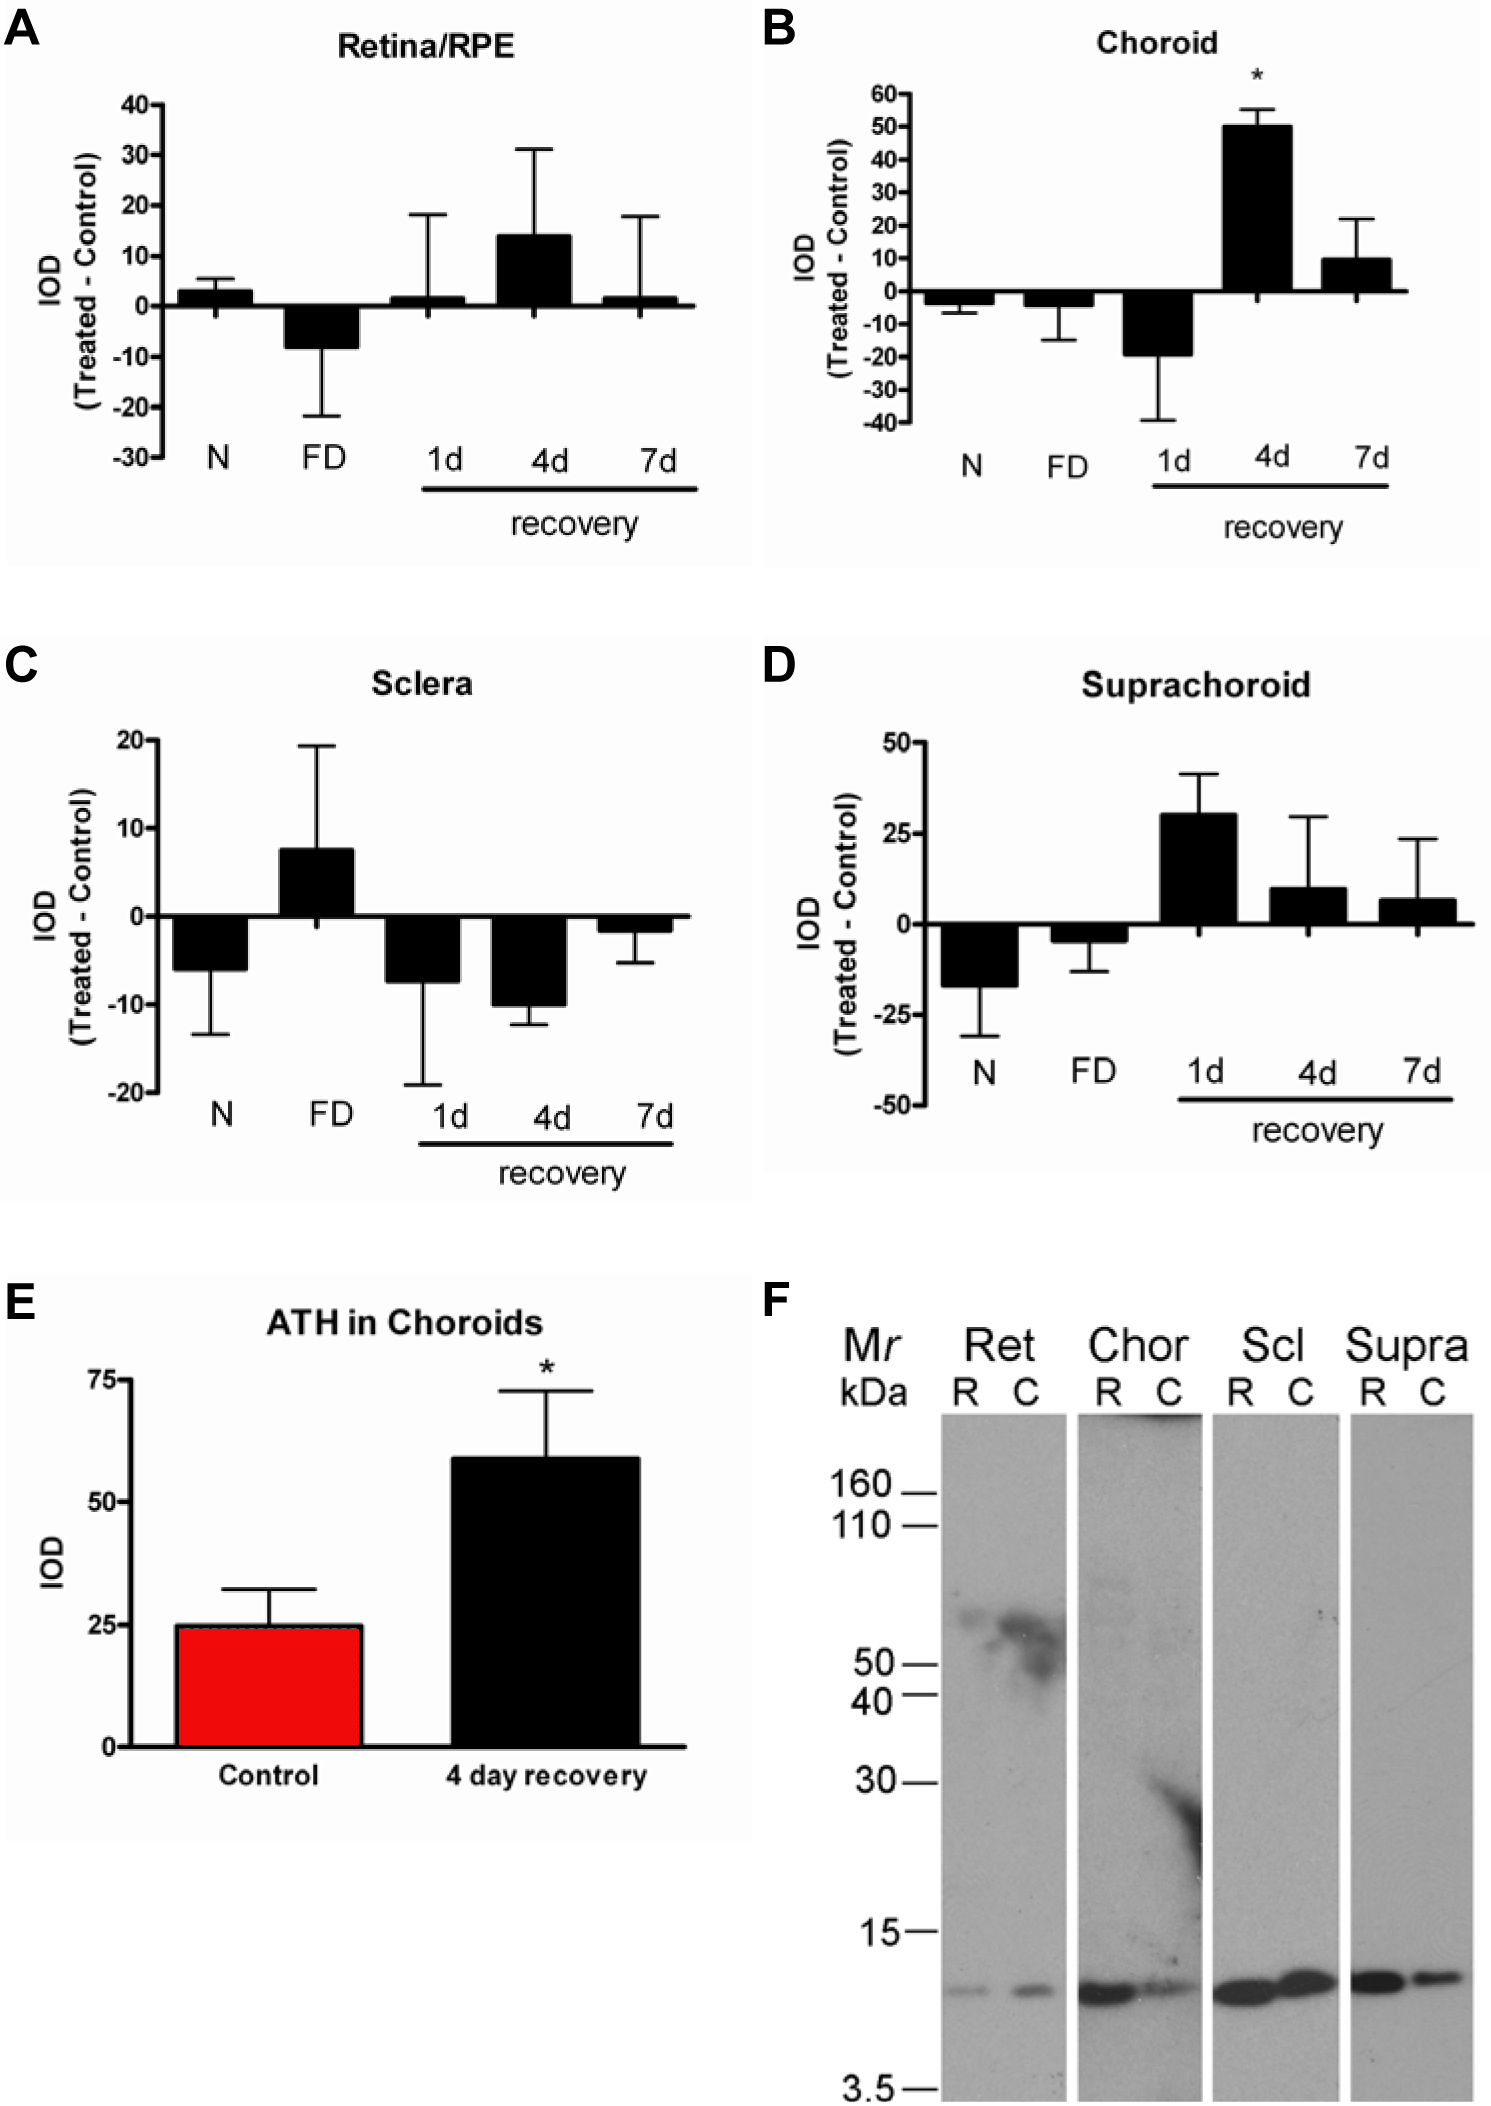
 Figure 7 of Rada, Mol Vis 2009; 15:778-792.