Figure 3. Scatter plot matrices of the two biologically replicated microarray analyses. Panel A shows microarray analysis 1. Panel B shows microarray analysis 2. In each scatterplot the POAG LC cell versus normal LC cell microarray expression data following
normalization with RMA is shown. All 22,283 Log base2 transformed probe (gene) signal intensities (range 0 - 14) for the normal
LC arrays are plotted on the x-axes and the corresponding value (range 0 - 14) for the POAG LC arrays on the y-axes. For each
probe (point), its position relative to the diagonal identity line (red) directly relates the ratio of expression in POAG
versus normal control. Probes that appear above the identity were overexpressed in POAG LC cells (upregulated); probes that
appear below the diagonal were overexpressed in the normal LC cells (down regulated). Probes with identical expression levels
in both POAG and normal LC cells appear along or on the identity line.
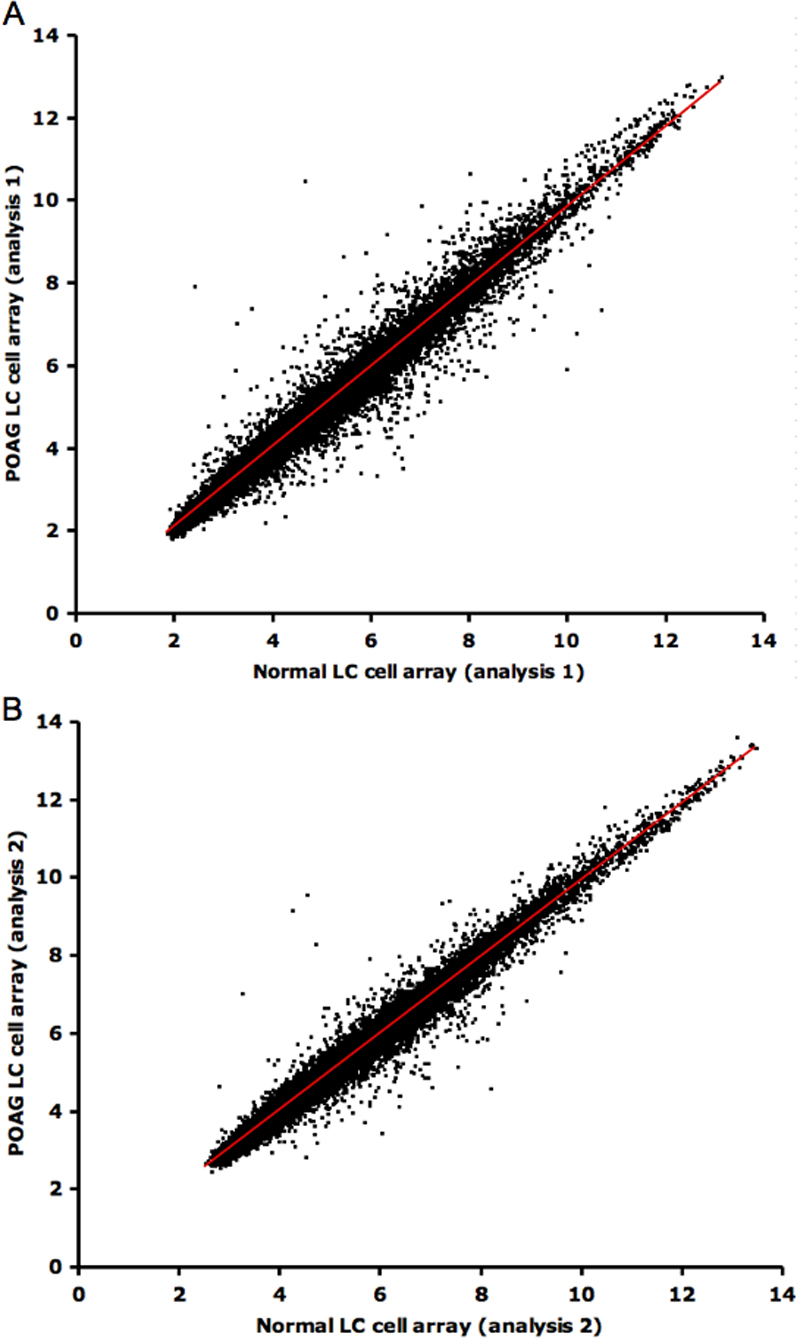
 Figure 3 of
Kirwan, Mol Vis 2009; 15:76-88.
Figure 3 of
Kirwan, Mol Vis 2009; 15:76-88.