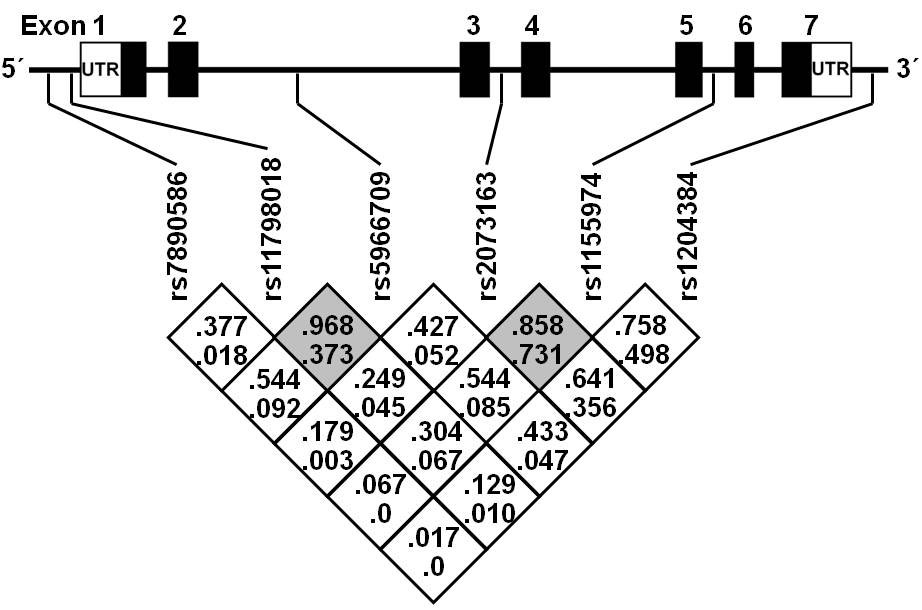
Figure 1. Location of the selected markers along the
TNMD gene and their pairwise linkage disequilibrium pattern, indicated by D'- (upper) and r2-values (lower). Two haploblocks,
defined by solid spine of linkage disequilibrium are denoted by gray shading. The first haploblock consists of markers
rs11798018 and
rs5966709, and the second consists of
rs2073163 and
rs1155974.
 Figure 1 of
Tolppanen, Mol Vis 2009; 15:762-770.
Figure 1 of
Tolppanen, Mol Vis 2009; 15:762-770.