Figure 3. Analysis of transmission electron microscope imaging. The cornea from one-month-old mice of the SAM R1 and the SAM P8 experimental
groups are shown (A and B, respectively). The thickness of the endothelium was greater than or equal to the thickness of the Descemet’s membrane. The
microvilli were abundant (locations indicated by arrows). C: Analysis of six-month-old specimens from the SAM R1 experimental group shows that the thickness of endothelium was also
less than or equal to the thickness of the descemet’s membrane. D: Analysis of six-month-old specimens from the SAM P8 experimental group shows that the thickness of the endothelium decreased
significantly and that many of the interstices were located in the interlamination. E: Analysis of 12-month-old specimens from the SAM R1 experimental group showed that the thickness of the endothelium was uneven
and that many of the interstices could be observed. F: Analysis of the 12-month-old specimens from the SAM P8 experimental group showed that the thickness of endothelium was very
thin. Scale bars: 1 μm. En: endothelium; De: Descemet’s membrane; St: stroma.
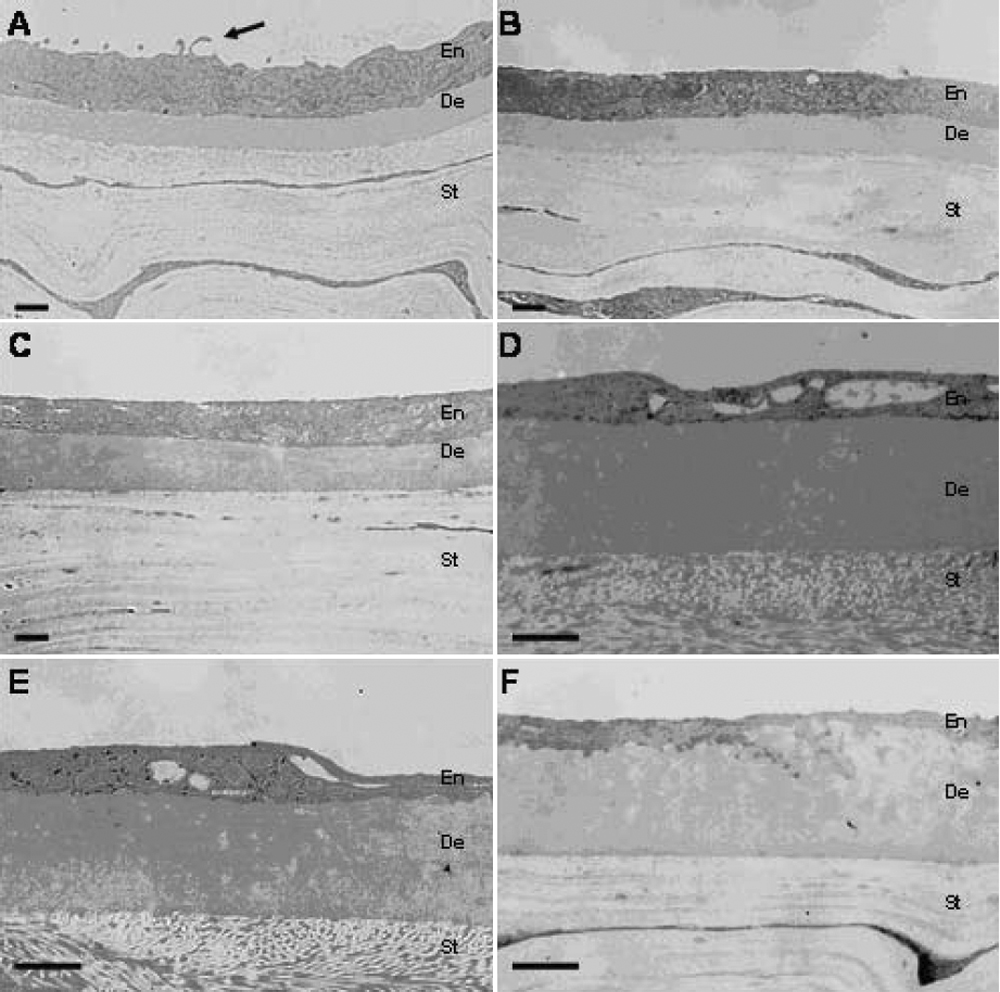
 Figure 3 of
Xiao, Mol Vis 2009; 15:747-761.
Figure 3 of
Xiao, Mol Vis 2009; 15:747-761.