Figure 2. Changes in the endothelial cell density values at various ages for each experimental group. The results indicate a significant
decrease in the ECD values of the SAM R1 strain at six months (p=0.010 versus one-month-old specimen) and at 12 months (p=0.000
versus both one- and six–month-old specimens). There is also a significant decrease in the ECD values of the SAM P8 specimens
at six months (p=0.000 versus one-month-old specimen) and at 12 months (p=0.000 versus both one- and six-month-old specimens).
In addition, there is no significant difference in the ECD values at one month between the SAM R1 and the SAM P8 strains (p=0.293),
but there is a significant decrease in the ECD values of both six- and 12–month-old specimens between the SAM R1 and the SAM
P8 strains (p=0.010 and p=0.042, respectively). The results indicate the decrease of ECD in SAM P8 is faster than in SAM R1.
An asterisks mark a statistically significant difference (p<0.05).
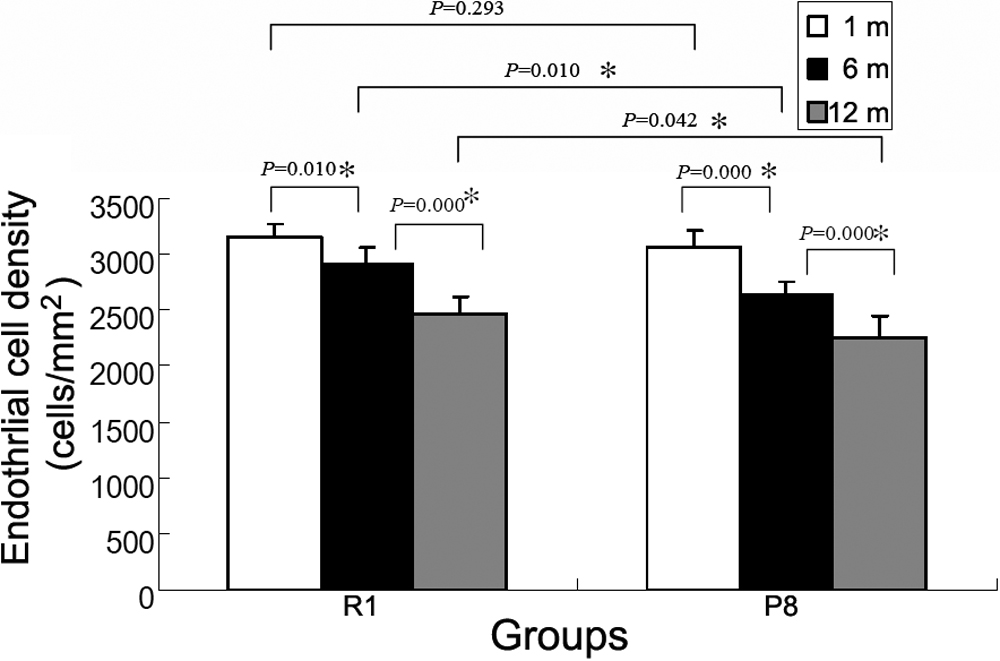
 Figure 2 of
Xiao, Mol Vis 2009; 15:747-761.
Figure 2 of
Xiao, Mol Vis 2009; 15:747-761.