Figure 2. PKC protein levels in the
retinal arteries and neuroretina. Phosphorylated and total PKCα, PKCβ1,
and PKCβ2 protein expression levels, assessed by western blot, in (A)
retinal arteries and (B) neuroretina, in eyes subjected to
ischemia and 12 (n=7) or 20 (n=5) hours of reperfusion versus
sham-operated eyes. The right panels are representative examples of
western blots of neuroretina and retinal arteries from animals in the
20 h of reperfusion group. Values are presented as mean values±SEM.
Statistical comparison was performed using Student’s paired ratio t-test
(ischemia–reperfusion versus sham) with Bonferroni correction. Exact
p-values are given in the figure.
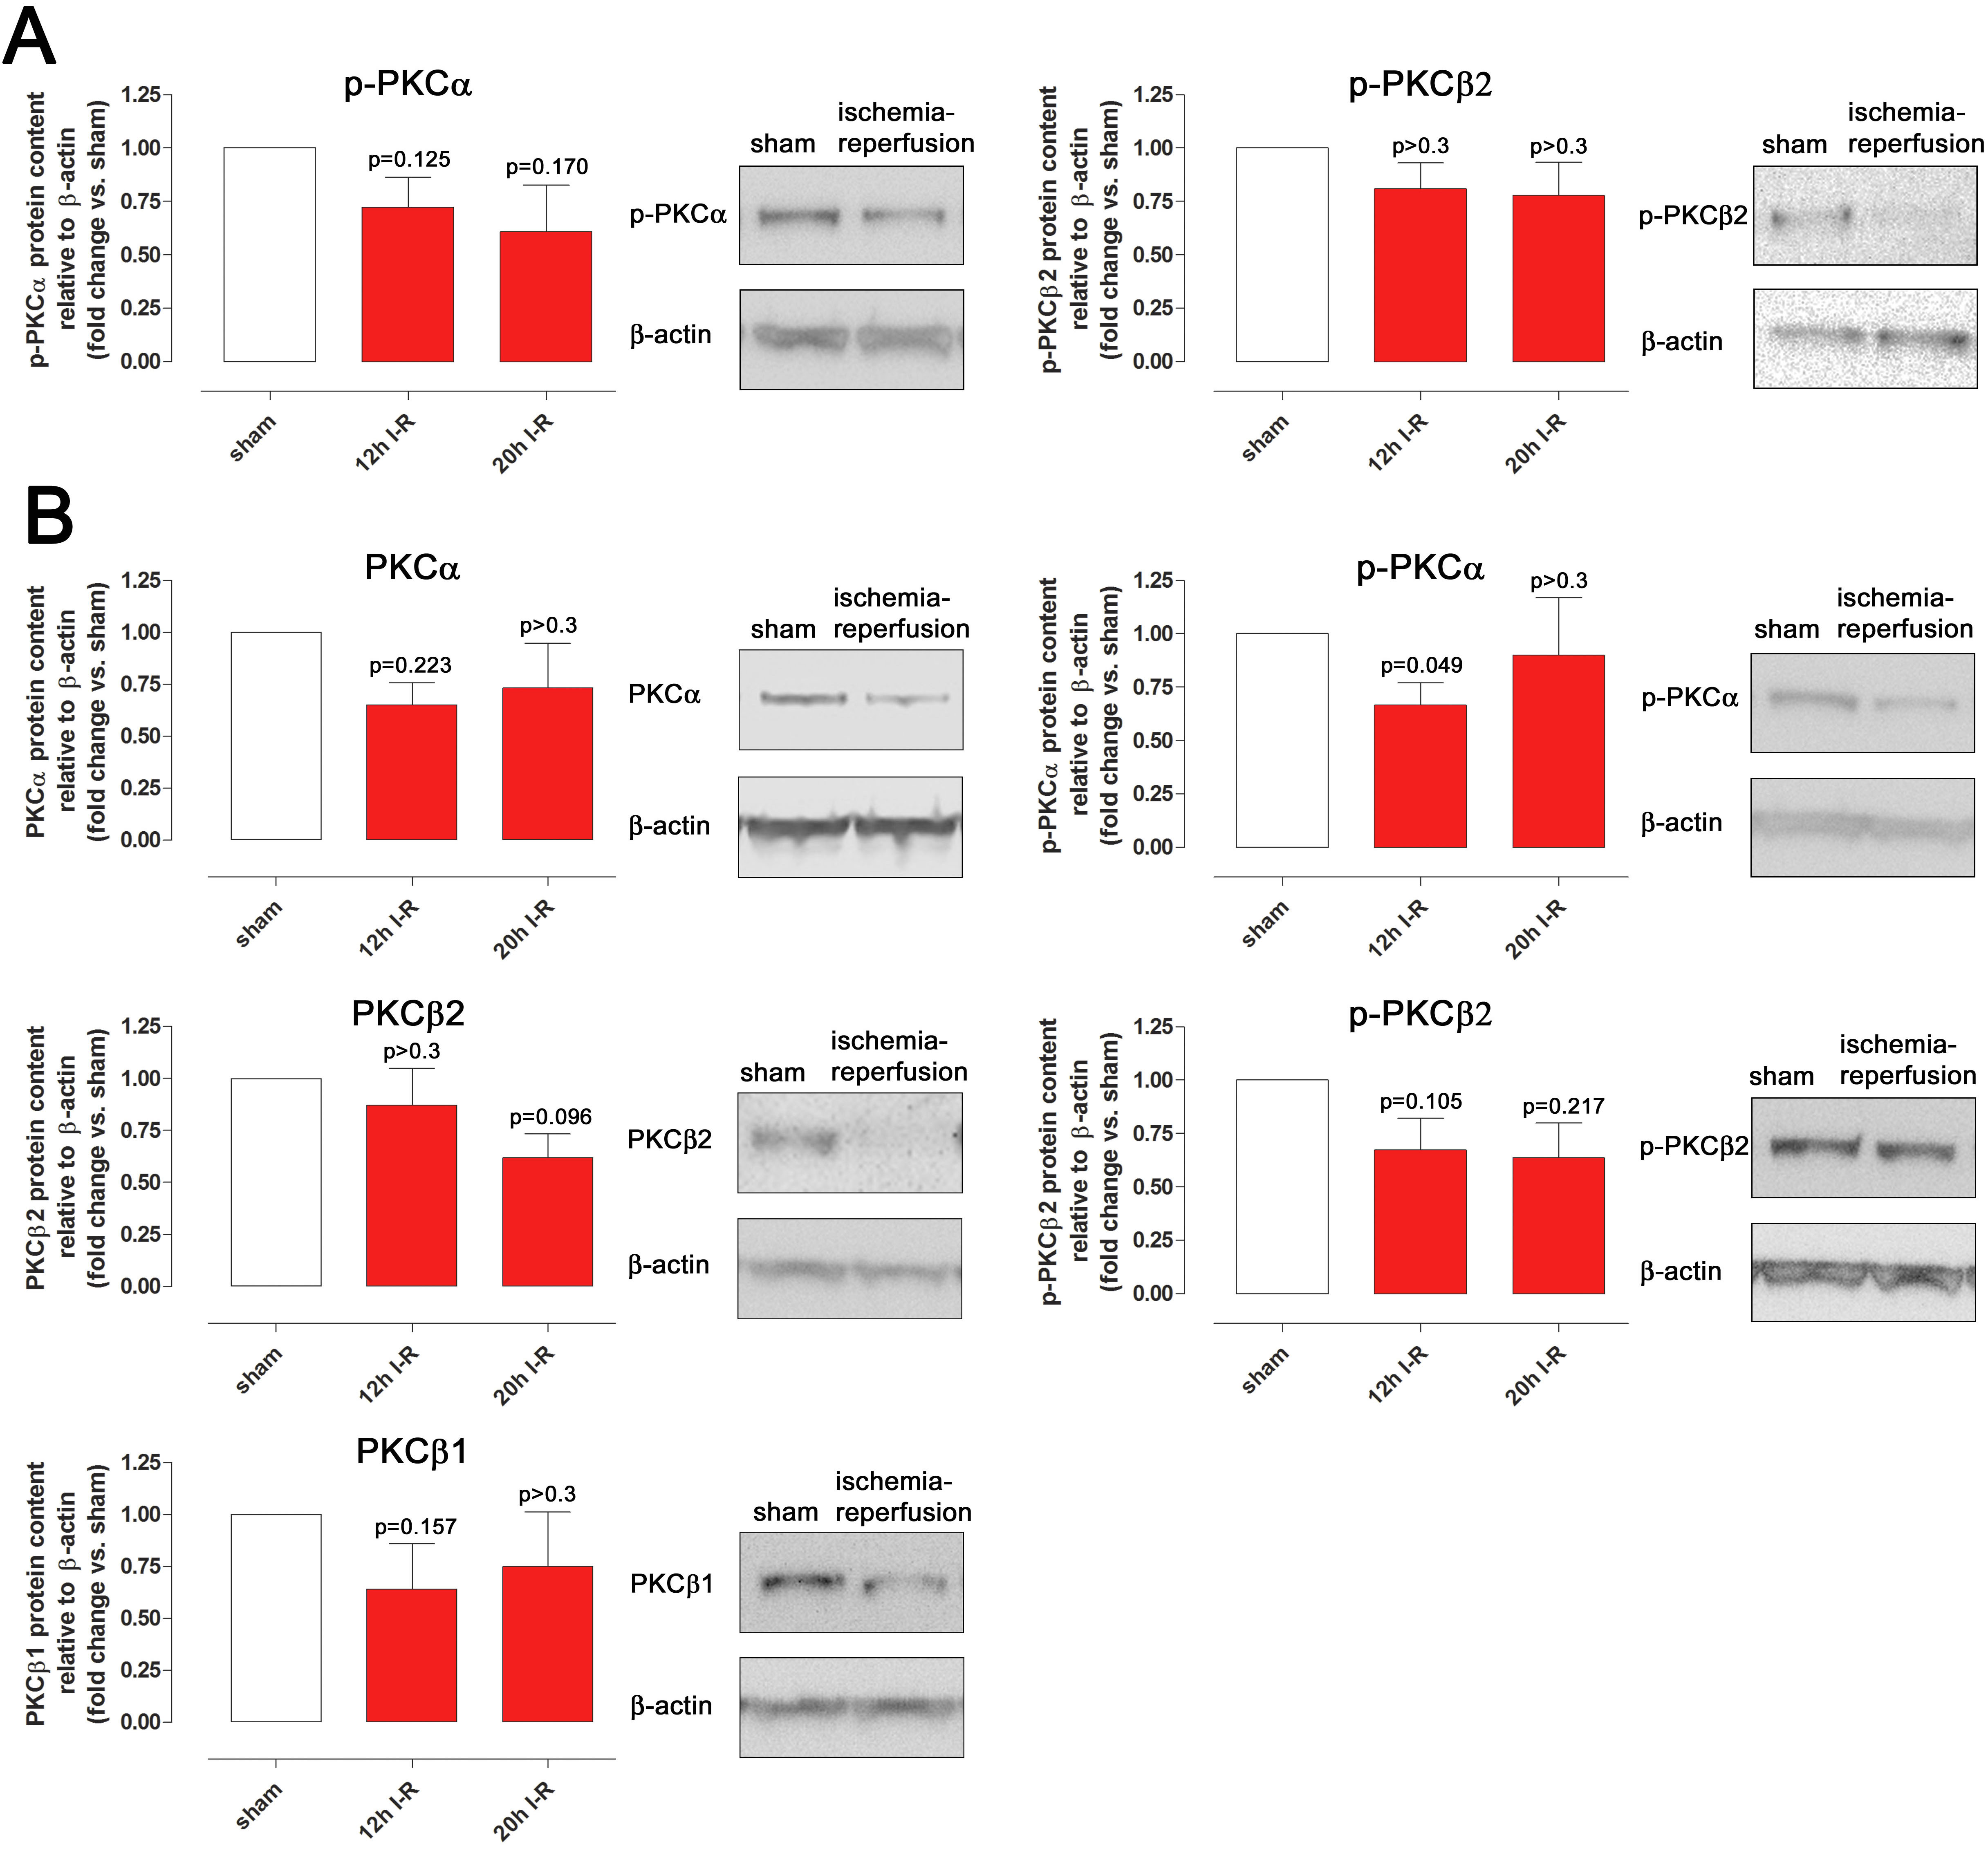
 Figure 2 of Gesslein, Mol Vis 2009; 15:737-746.