Figure 4. P-CREB blockade decreases
NMDA-mediated cell proliferation. A-C: Photomicrographs show
DAPI stained cells incubated in the absence (A) or presence (B)
of 25 μM CREB inhibitor, for 48 h and cultured in fresh medium for
additional 48 h. C: Graph shows quantification of control and
CREB inhibitor treated cells. Data represent mean±SEM of cells counted
on five nonoverlapping fields in three experiments. Asterisk (*)
denotes p<0.05 compared to control. D-F: Photomicrographs
show DAPI and TUNEL stained control (D) and CREB inhibitor (E)
treated cells. F: Graph shows quantification of TUNEL positive
cells in control, 100 μM NMDA, NMDA plus 25 μM CREB inhibitor or CREB
inhibitor treated cells. Data are represented as in C. G-I:
Photomicrographs show DAPI, BrdU, and P-CREB stained cells that were
untreated (G) or treated with 100 μM NMDA (H) or NMDA
plus CREB inhibitor (I). Calibration bar equals 50 μm in A, D,
and I.
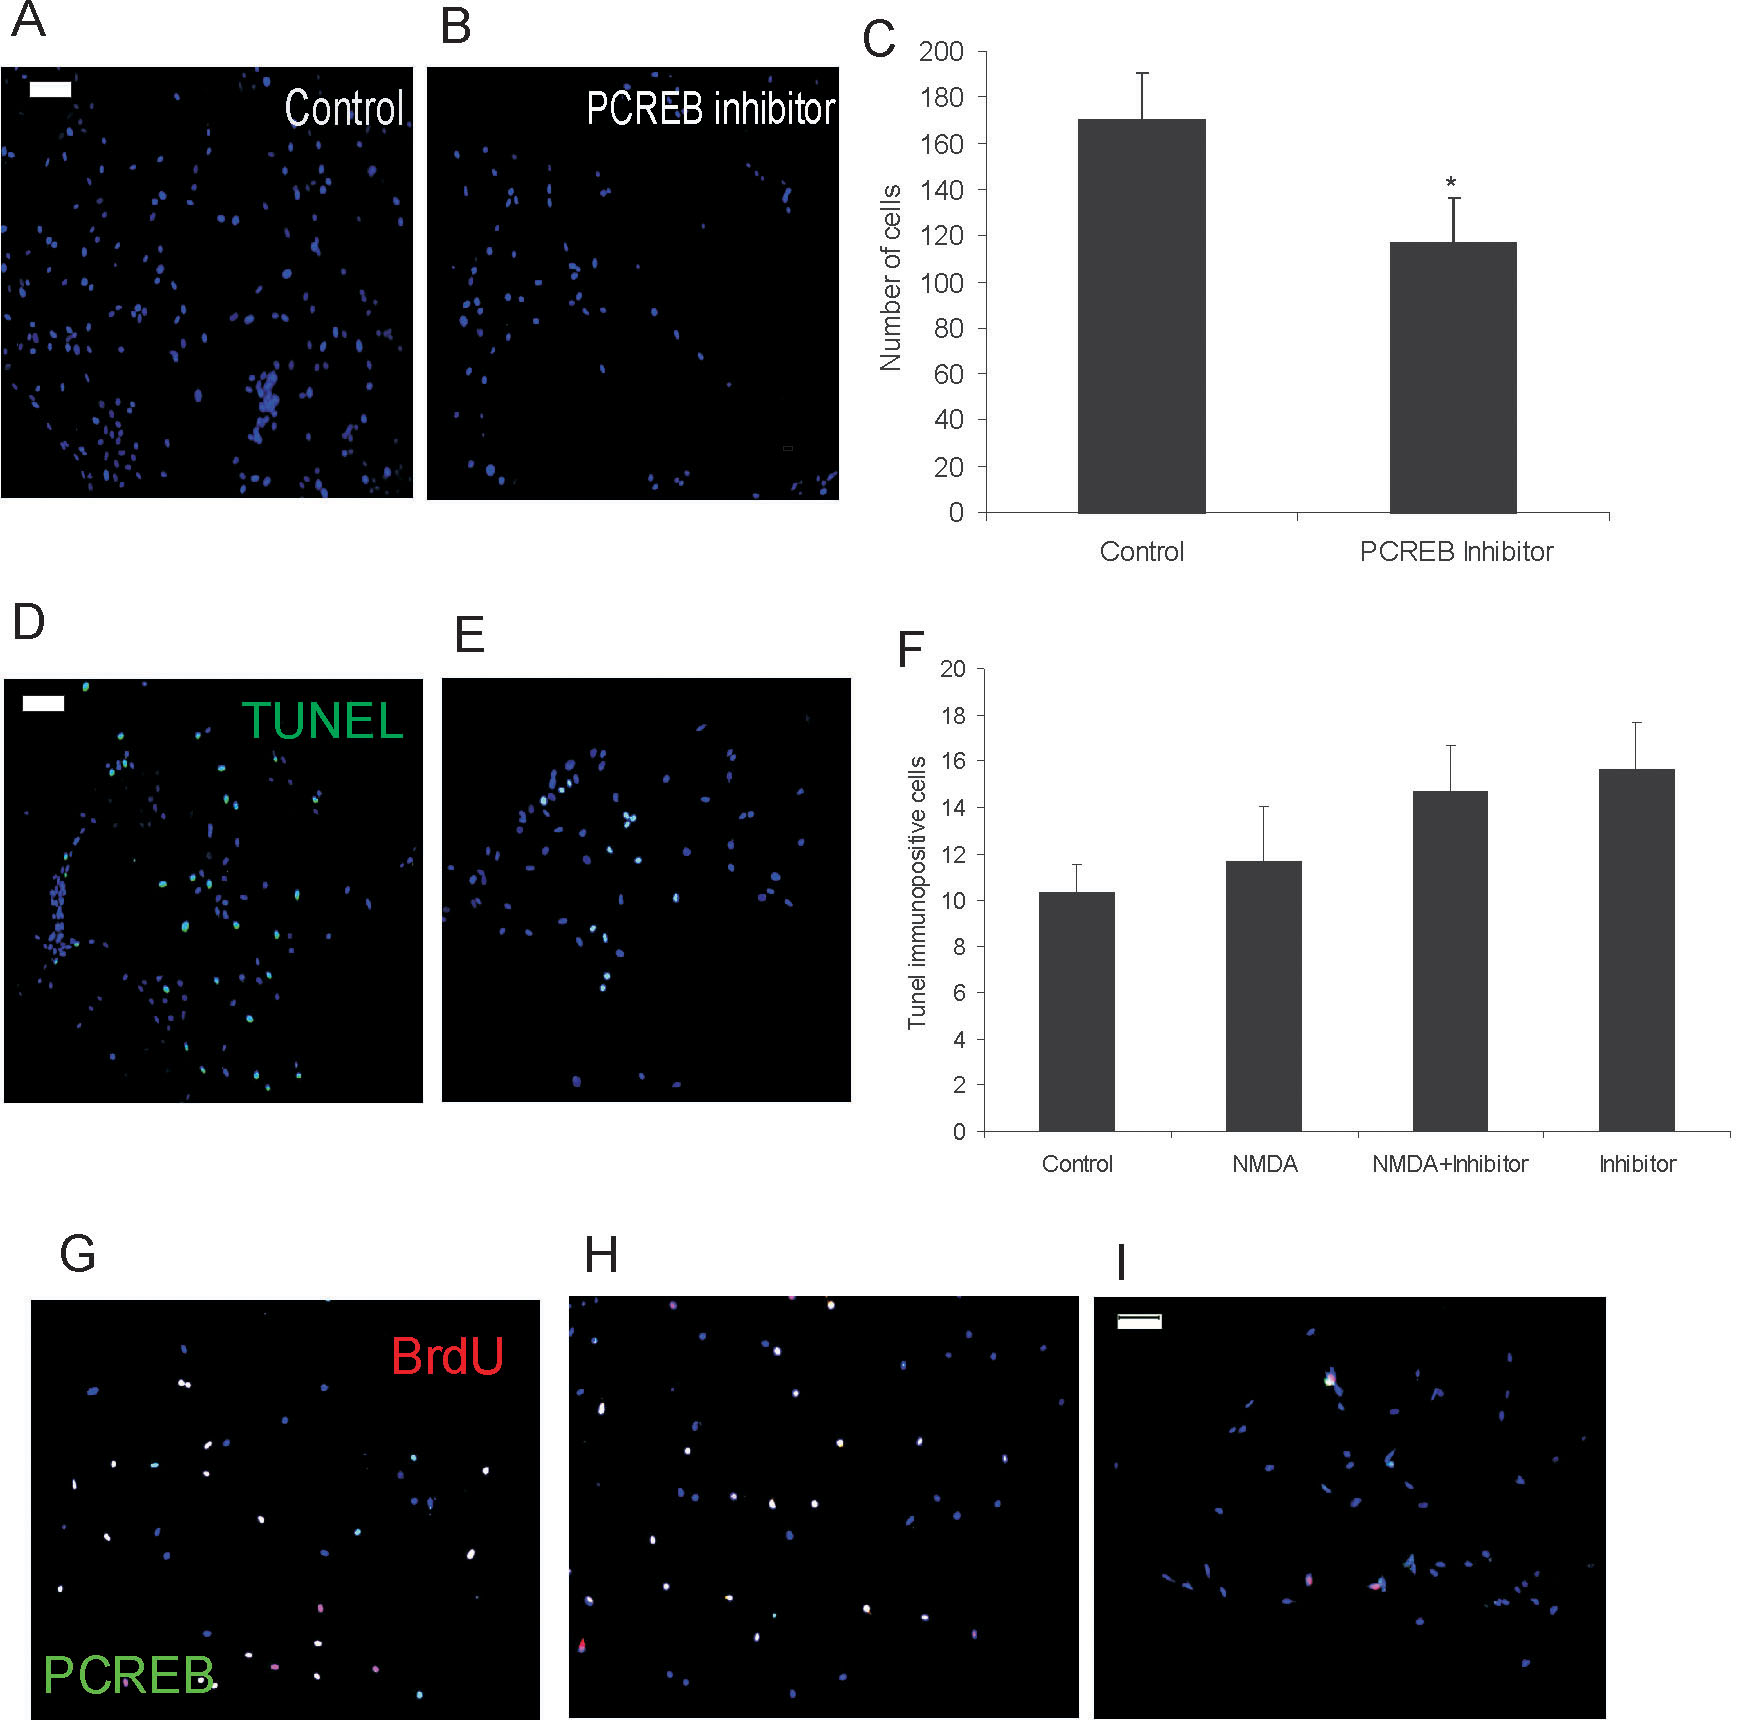
 Figure 4 of Ramírez, Mol Vis 2009; 15:713-721.