Figure 3. NMDA induces CREB
phosphorylation in retinal progenitors. A-C: Photomicrographs
show P-CREB labeled cells counterstained with DAPI after no treatment (A)
and 100 μM NMDA (B), or glutamate (C). D: Graph
shows the quantification of nestin-P-CREB double-positive cells in
control, NMDA, or glutamate-treated cultures. Data represent mean±SEM
of 100 cells counted on nonoverlapping fields in three experiments.
Double asterisks (**) indicate p<0.05 compared to control. E:
Graph shows the percentage of P-CREB positive cells after no treatment,
100 μM NMDA, or 100 μM NMDA plus 50 μM MK801. Data represent the
percentage of P-CREB positive cells with respect to total number of
cells counted on five nonoverlapping fields. F-G:
Photomicrographs show NR1-P-CREB (F) and nestin-P-CREB
double-labeled cells (G) counterstained with DAPI. Calibration
bar equals 100 μm in A-C and 20 μm in F.
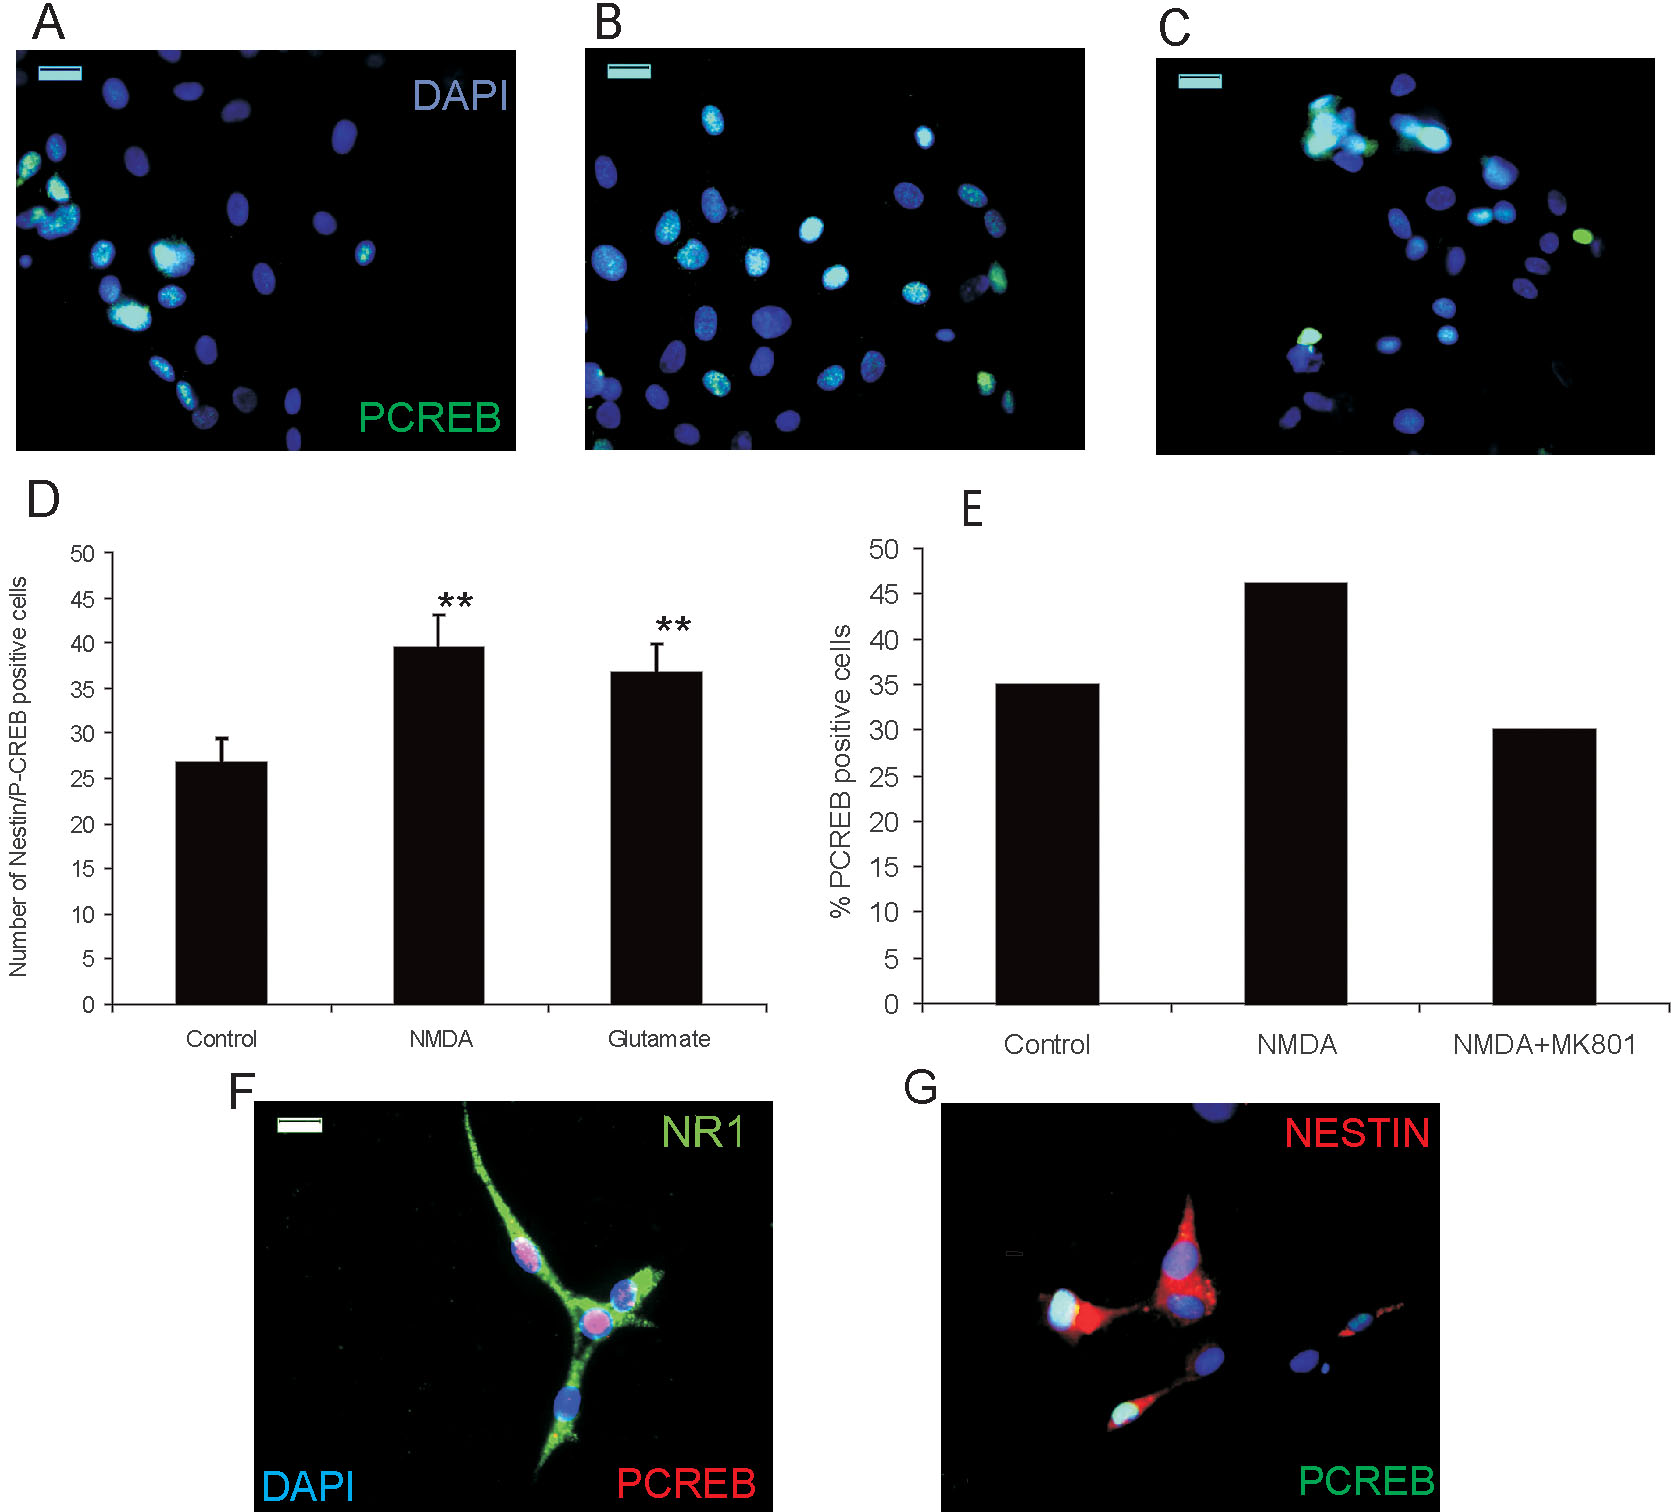
 Figure 3 of Ramírez, Mol Vis 2009; 15:713-721.