Figure 2. NMDA induces postnatal
Müller-derived progenitor proliferation. A-D: Photomicrographs
show neurospheres double-labeled with nestin and BrdU (A) or
single-labeled with BrdU (B), nestin (C), and merge (D).
E-F: Dissociated BrdU-labeled cells that received no treatment (E)
or 500 μM NMDA (F). G: Quantification of BrdU positive
cells after no treatment, 50–100–500 μM NMDA or glutamate, 50 μM
antagonist MK801 or 100 μM NMDA plus antagonist. H-I:
Photomicrographs show dissociated Ki67-labeled cells after no treatment
(H) or 500 μM NMDA (I). J: Quantification of Ki67
positive cells after no treatment, 100–500 μM NMDA or glutamate, and
500 μM NMDA plus 50 μM MK801. Calibration bar equals 50 μm in A,
E, and H, and 200 μm in B. Data represent
mean±SEM of 300 cells counted on nonoverlapping fields in three
experiments. Asterisk (*) indicates p<0.05 and double asterisk (**)
p<0.01 compared to control.
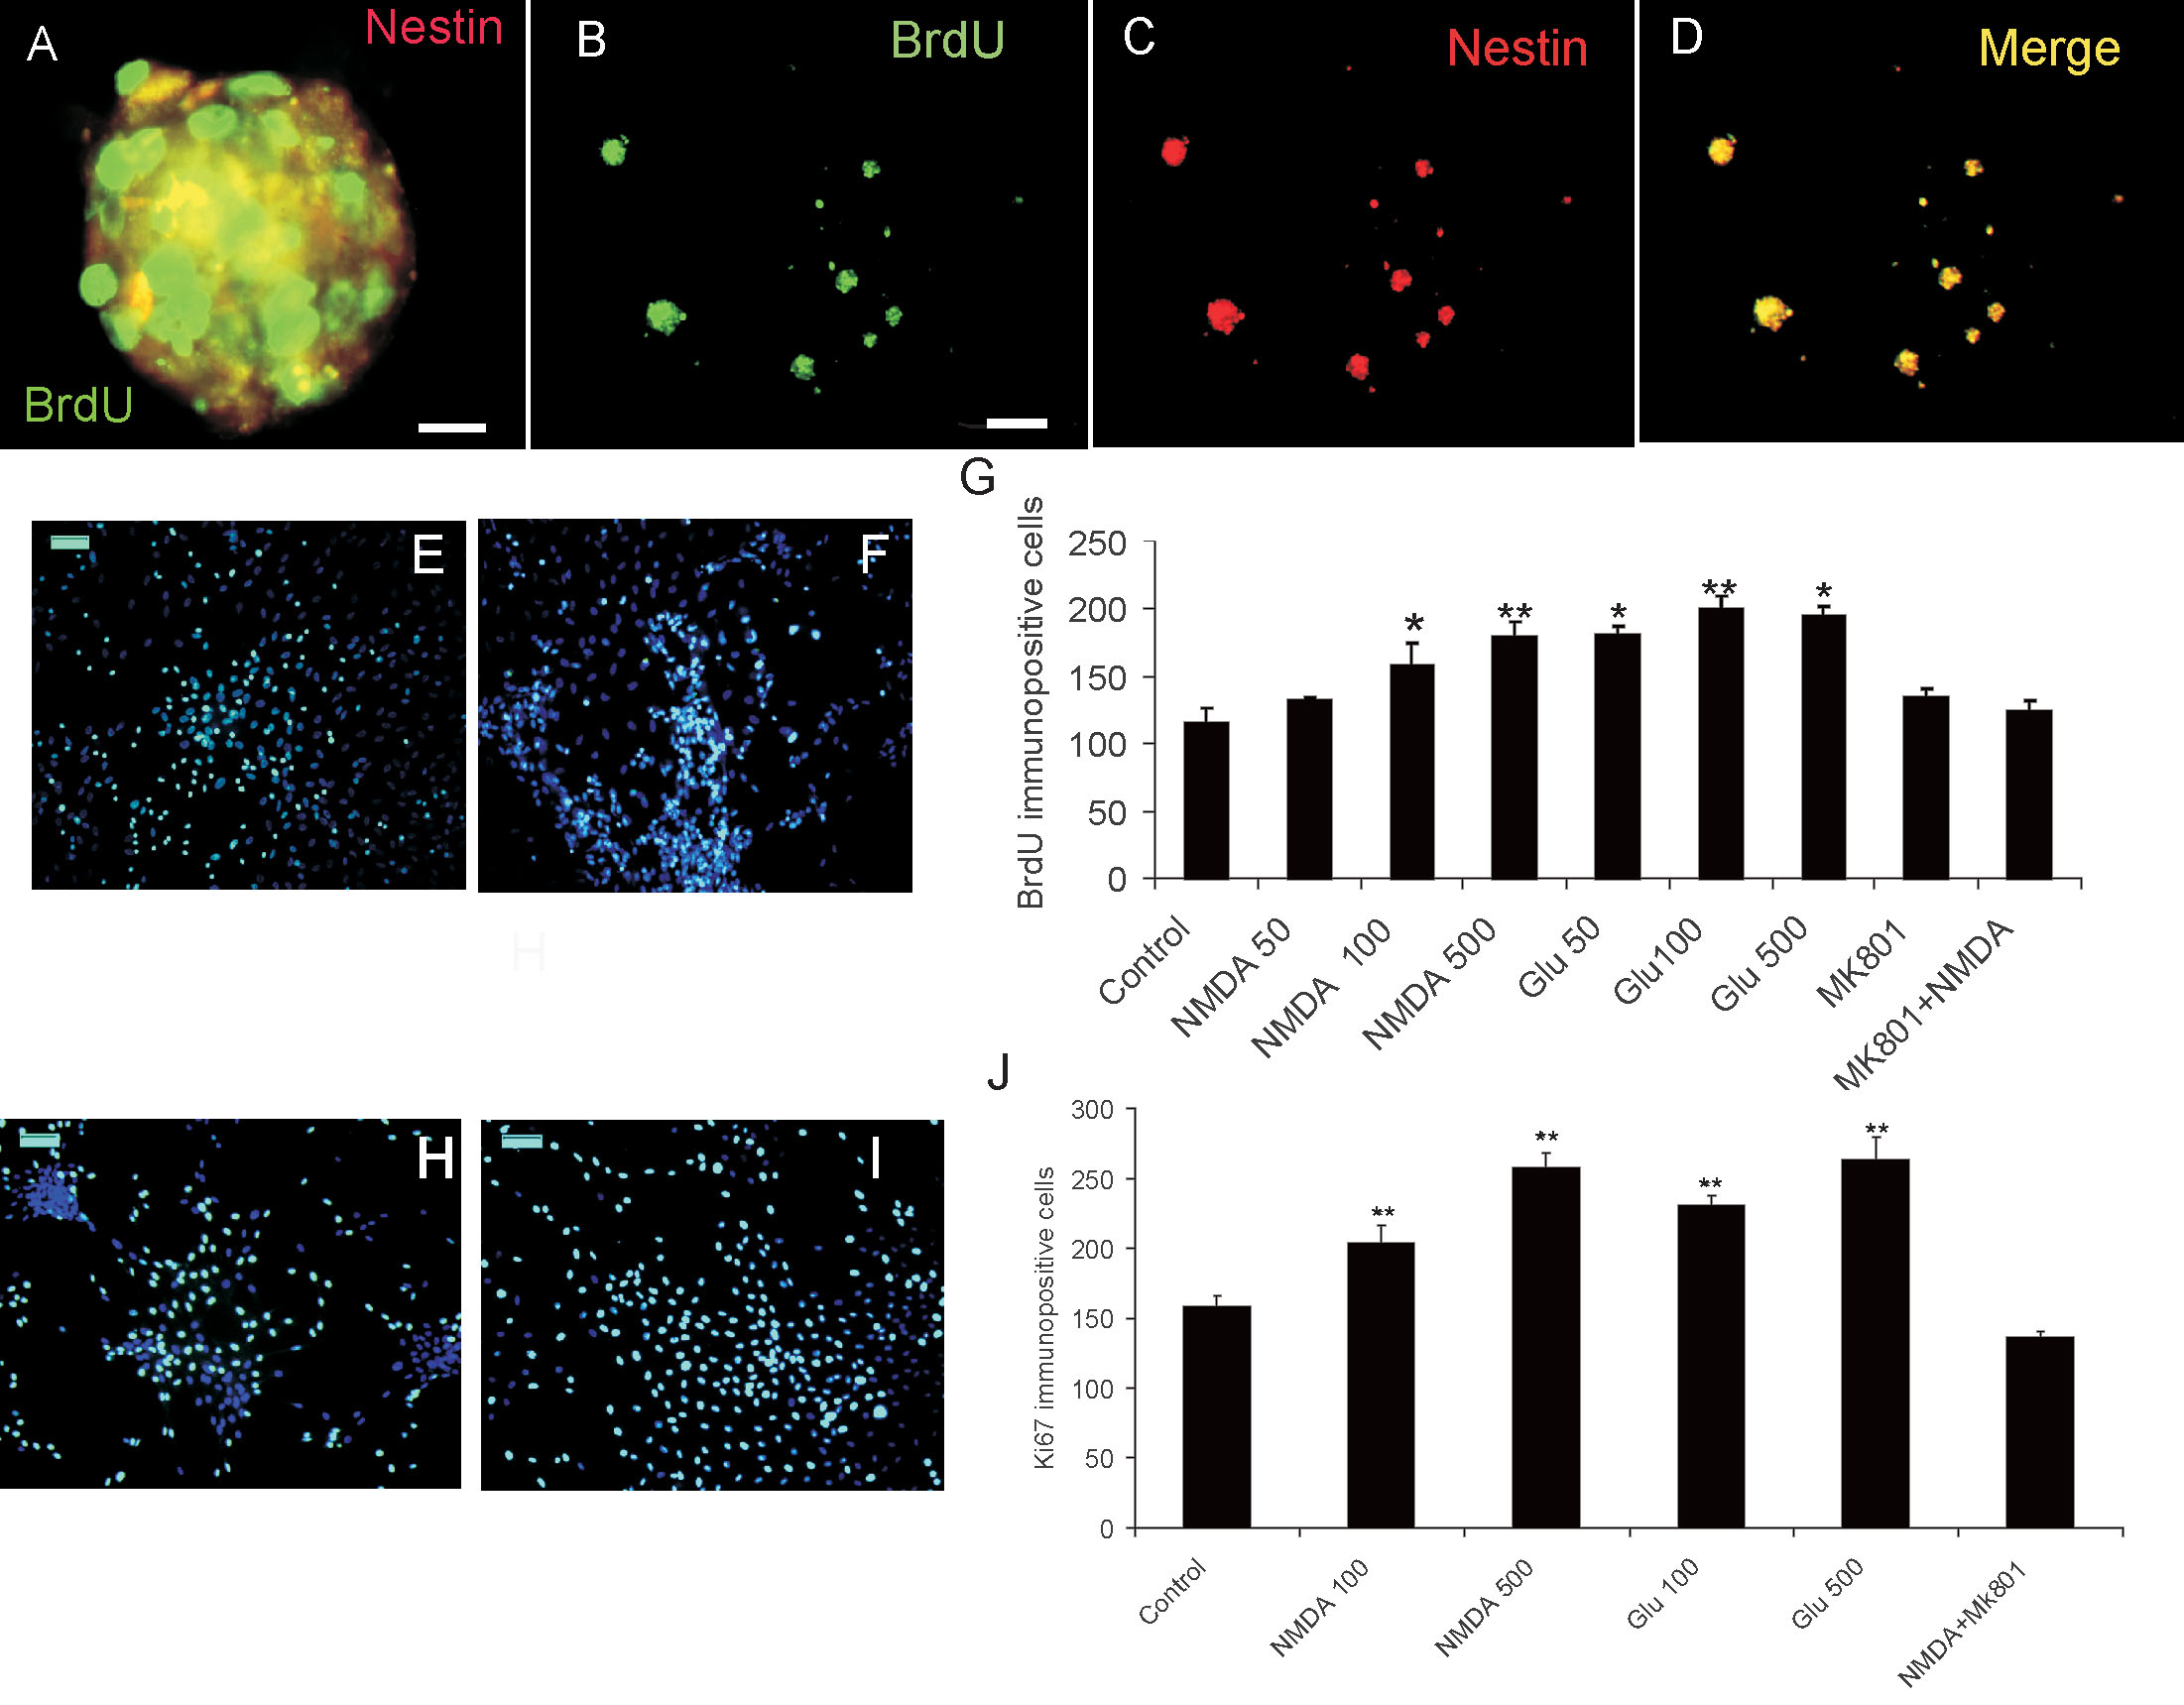
 Figure 2 of Ramírez, Mol Vis 2009; 15:713-721.