Figure 1 of
Mootha, Mol Vis 2009; 15:706-712.
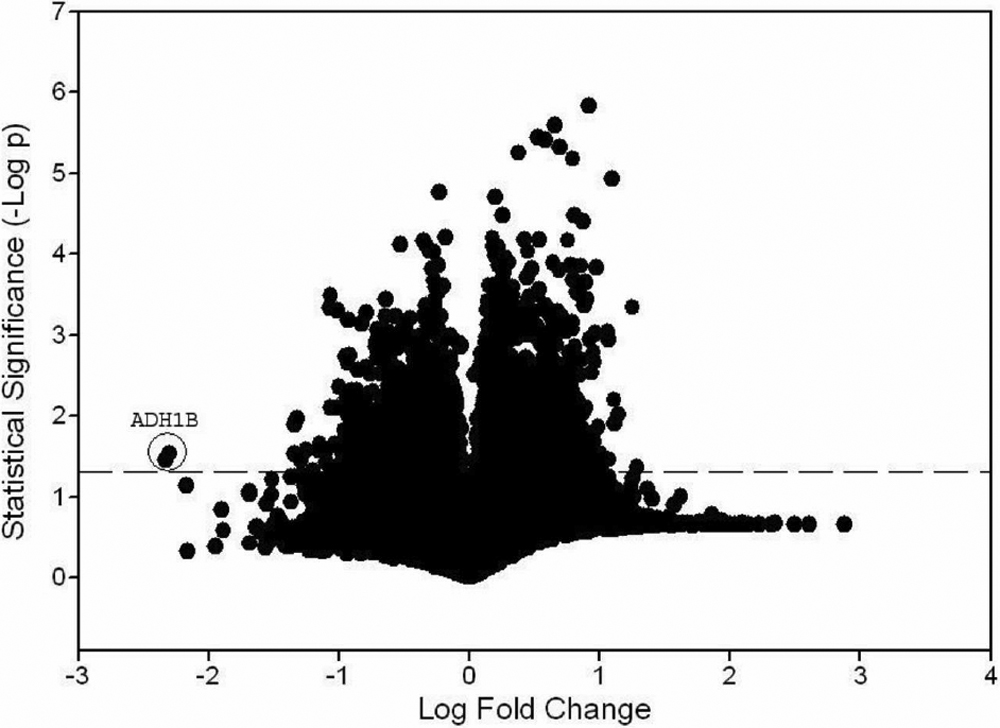
Figure 1.
Fold change and p value data from microarray experiments. Encircled points represent transcripts for
ADH1B
(Probe sets 209612_s_at and 209613_s_at). Dashed line marks that p=0.05 and statistical significance.
 Figure 1 of
Mootha, Mol Vis 2009; 15:706-712.
Figure 1 of
Mootha, Mol Vis 2009; 15:706-712.