Figure 9. VEGF expression after
photocoagulation in RPE-choroid complex. A: The amount of
vascular endothelial growth factor (VEGF) transcripts was
compared with 18S transcripts (y-axis) expressed in the same
samples. Four eyes were assessed at each time point. Values in
histogram are means±SEM B-C: Representative samples of PCR
fragments (individual ratio VEGF:18S closest to the
corresponding mean) were analyzed by 3% agarose gel electrophoresis and
visualized by ethidium bromide staining under ultraviolet light for
10–12-week-old mice (B) and 1-year-old mice (C). Prior to
laser treatment, VEGF mRNA expression was lower in old control
mice versus young control mice (p<0.001). At day 3 after PC, the
highest level of VEGF mRNA was 2.7 times higher than the
controls in old mice. In young mice the highest level of expression was
reached at 16 h after photocoagulation and did not exceed 1.3 times the
level observed in controls.
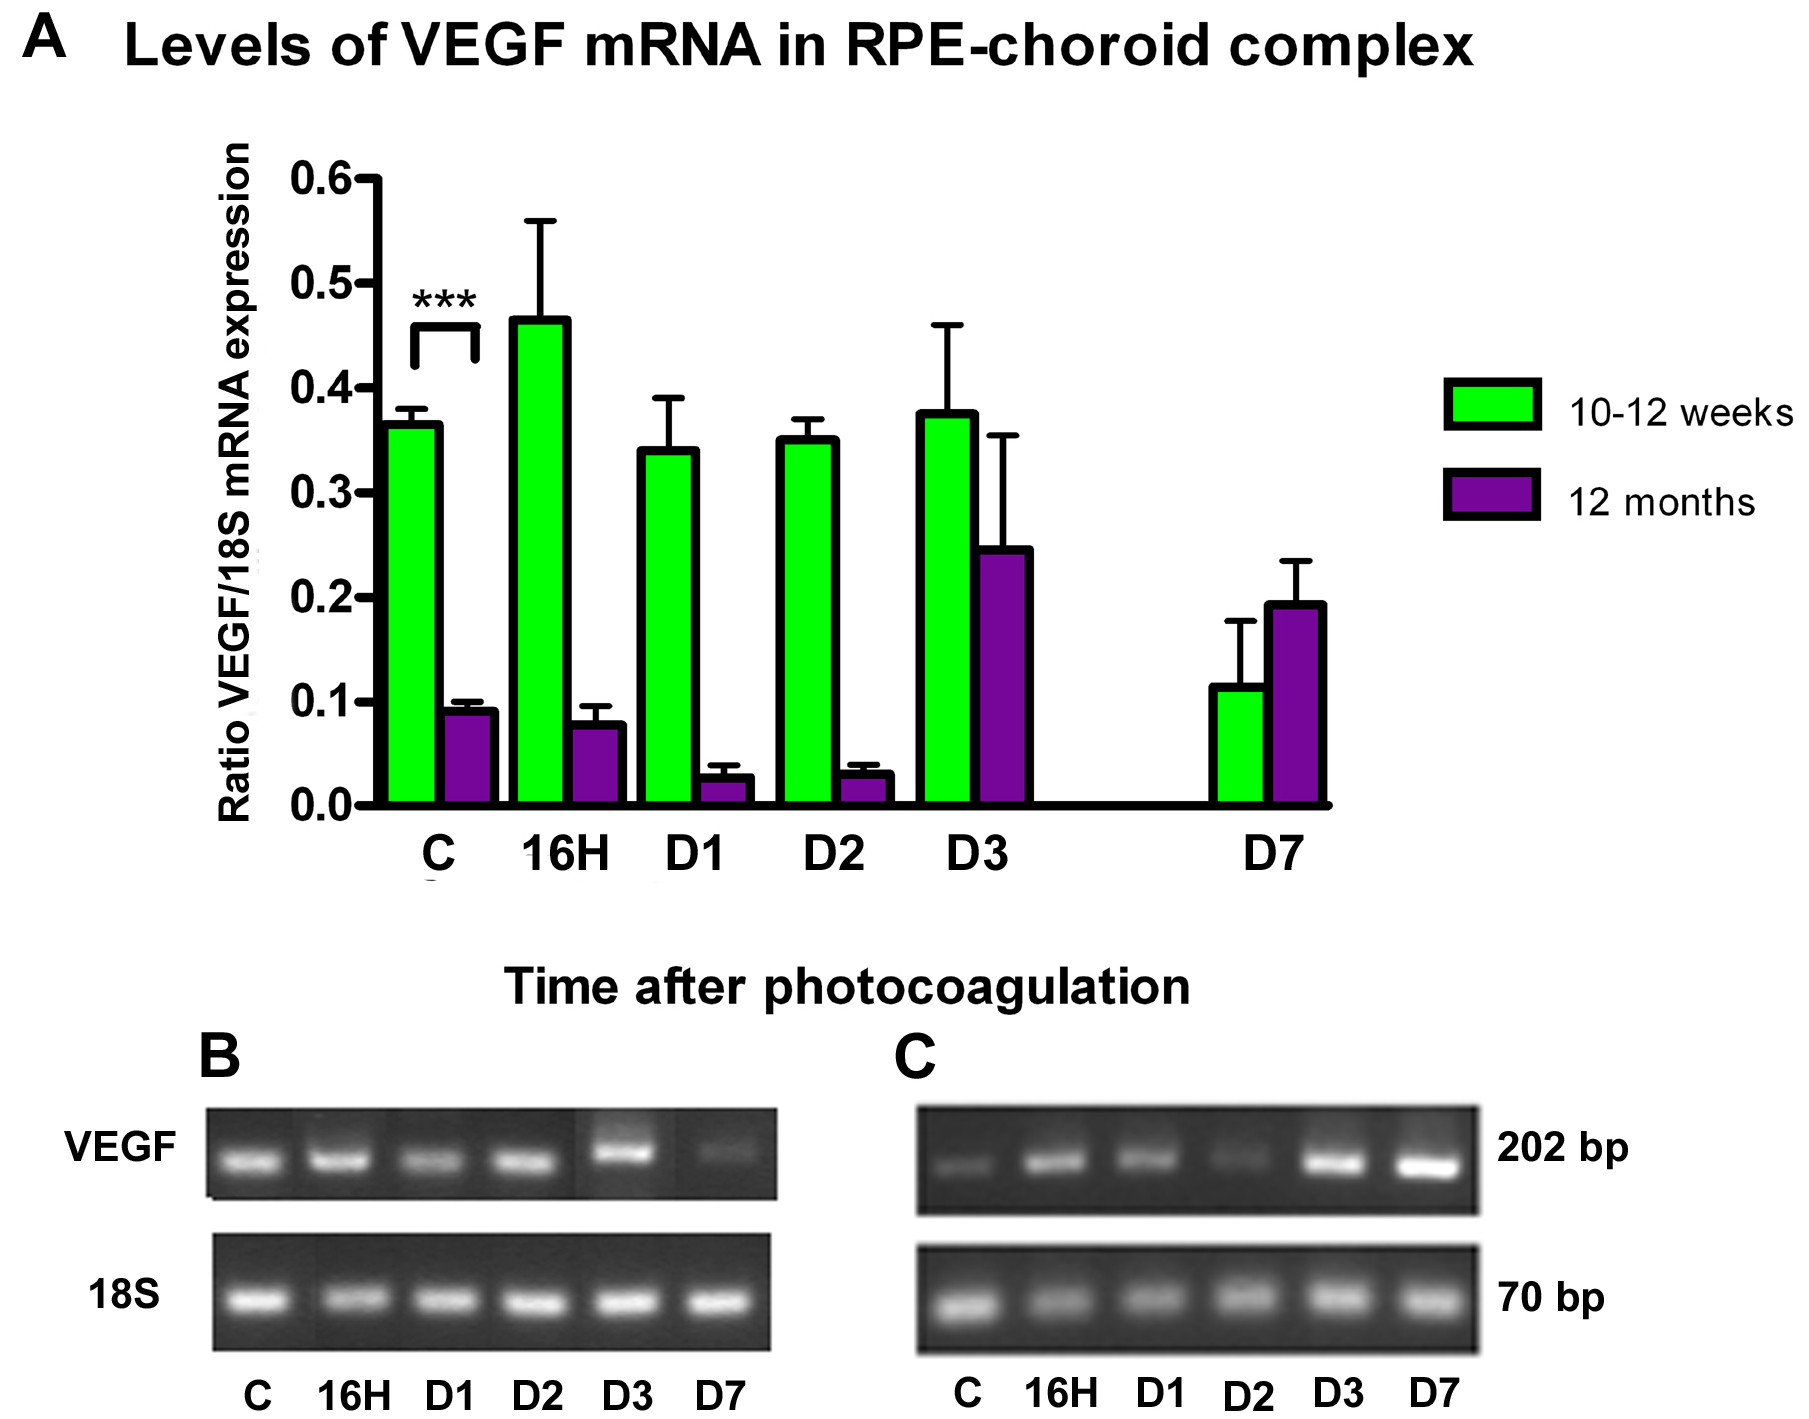
 Figure 9 of Dot, Mol Vis 2009; 15:670-684.