Figure 8. GFAP expression after
photocoagulation in neural retina. A: The amount of glial
fibrillary acidic protein (GFAP) transcripts was compared with 18S
transcripts (y-axis) expressed in the same samples. Four eyes were
assessed at each time point. Values in histogram are means±SEM B-C:
Representative samples of PCR fragments (individual ratio GFAP:18S
closest to the corresponding mean) were analyzed by 3% agarose gel
electrophoresis and visualized by ethidium bromide staining under
ultraviolet light for 10–12-week-old mice (B) and 1-year-old
mice (C). Prior to laser treatment, GFAP mRNA was highly
expressed in old control mice versus young control mice (p=0.025).
Following laser treatment mRNA expression was increased in the two
groups, reaching higher levels at 16 h and day 7. Compared to control
mice in each group, the increase of GFAP mRNA level is
statistically significant at 16 h (p=0.04 in young group; p=0.03 in old
group) and at day 7 (p=0.03 in old group).
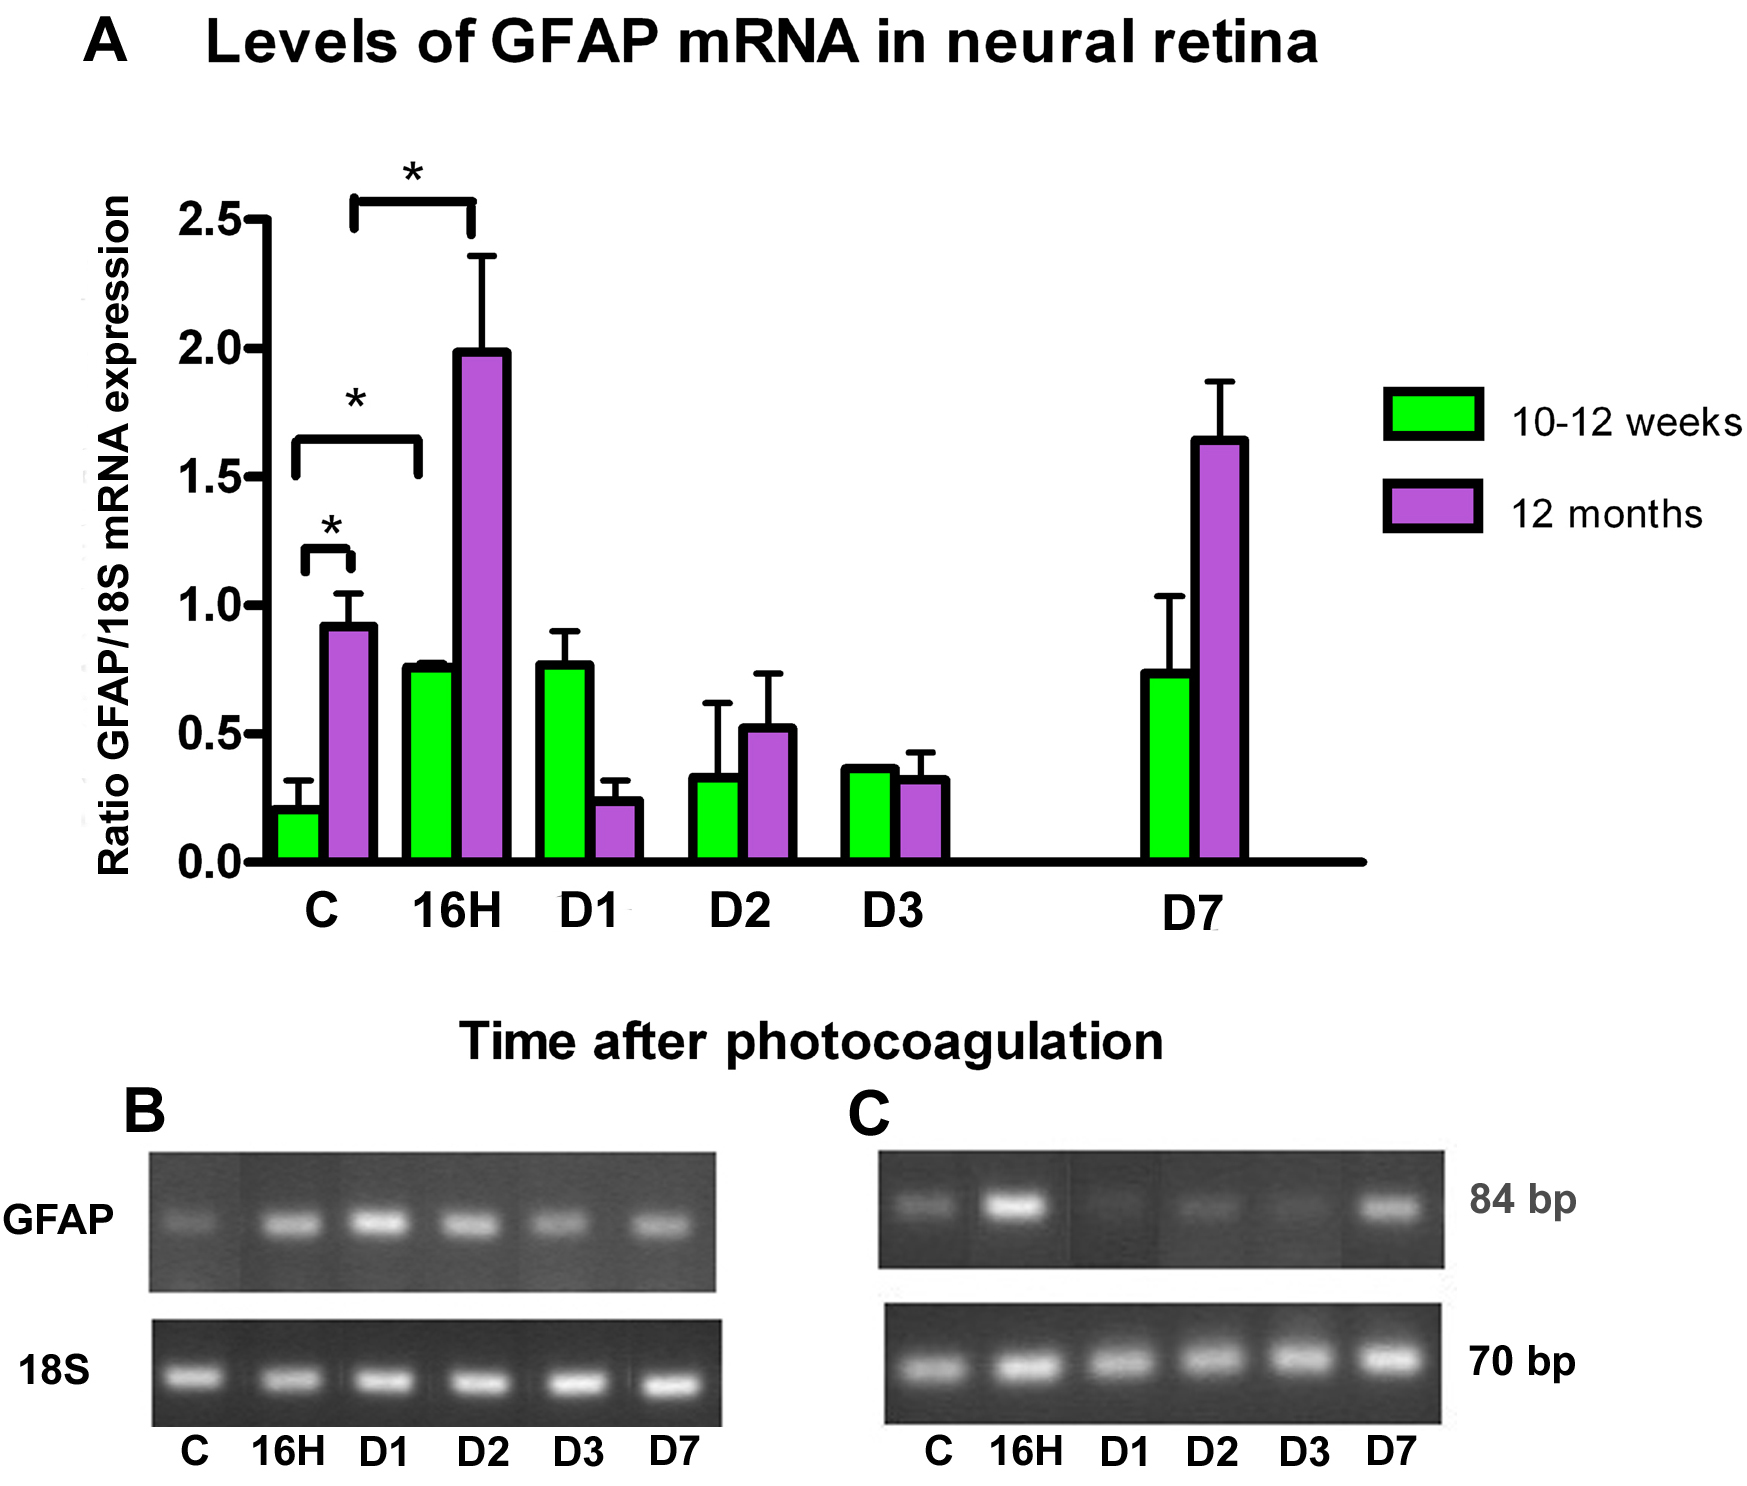
 Figure 8 of Dot, Mol Vis 2009; 15:670-684.