Figure 4. BDNF-positive cells of sections
of the SC. A: Representative microphotographs of the superior
colliculus (SC; the contralateral side and the ipsilateral side) are
shown for the control group (untreated) 3, 7, 30, 90, and 180 days
after N-methyl-D-aspartate (NMDA) injection. The scale bar
represents 30 µm. B: Representative photographs show
brain-derived neurotrophic factor (BDNF) and neuronal nuclear specific
protein (NeuN) immunostaining, and BDNF/NeuN double-immunostaining of
the contralateral SC at 30 days after intravitreal NMDA injection in
mice. Some BDNF-expressing cells were colocalized with NeuN-positive
neuronal cells, as indicated by the yellow color. The scale bar
represents 20 µm. C: The average number of BDNF immunopositive
puncta was counted in the SC. Each value represents the mean±SEM (n=3).
The asterisk indicates p<0.05, while the double asterisk represents
p<0.01 versus control (untreated mice; Dunnett’s test).
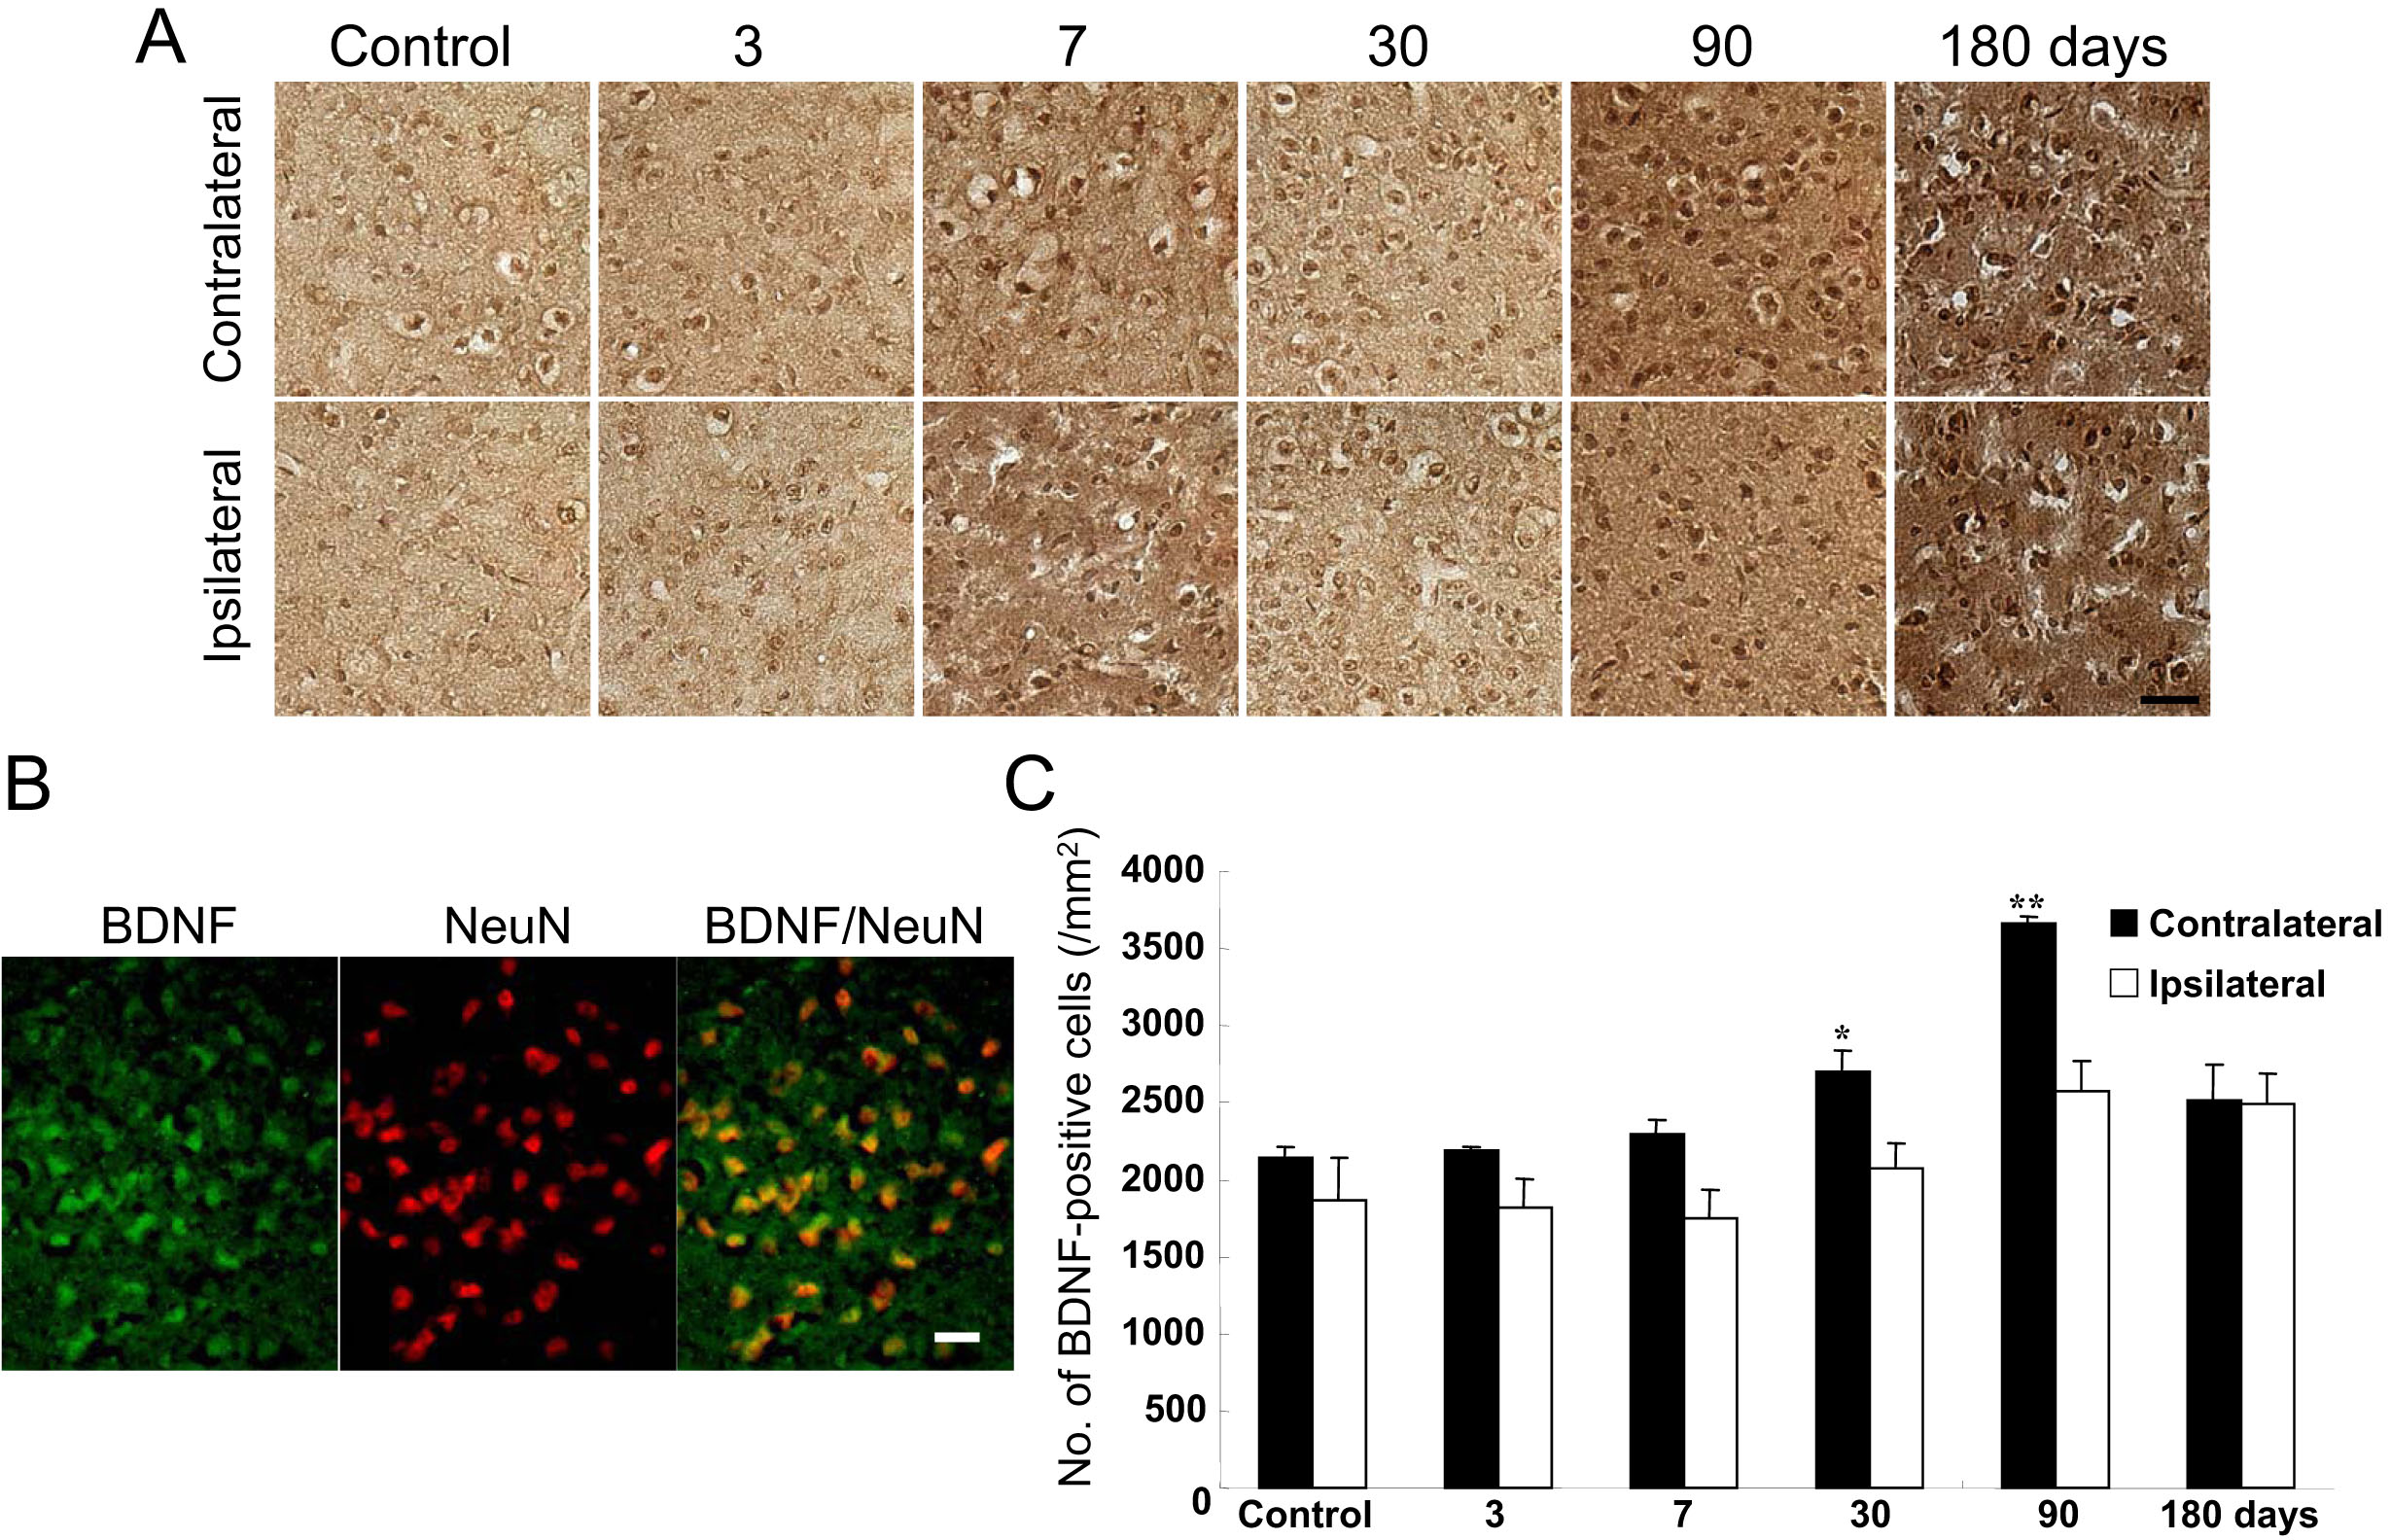
 Figure 4 of Tanaka, Mol Vis 2009; 15:662-669.