Figure 2. NeuN immunostaining of sections
of the SC. A: Representative microphotographs of the superior
colliculus (SC) are shown for the control group (untreated) for 180
days after N-methyl-D-aspartate (NMDA) injection (the
contralateral side and the ipsilateral side). The scale bars represent
30 µm. B:
The average number of neuronal nuclear specific protein (NeuN)-labeled
neurons was counted in the SC. Each value represents the mean±SEM
(n=4–11). The asterisk indicates p<0.05, while the double asterisk
represents p<0.01 versus control (untreated mice; Dunnett’s test).
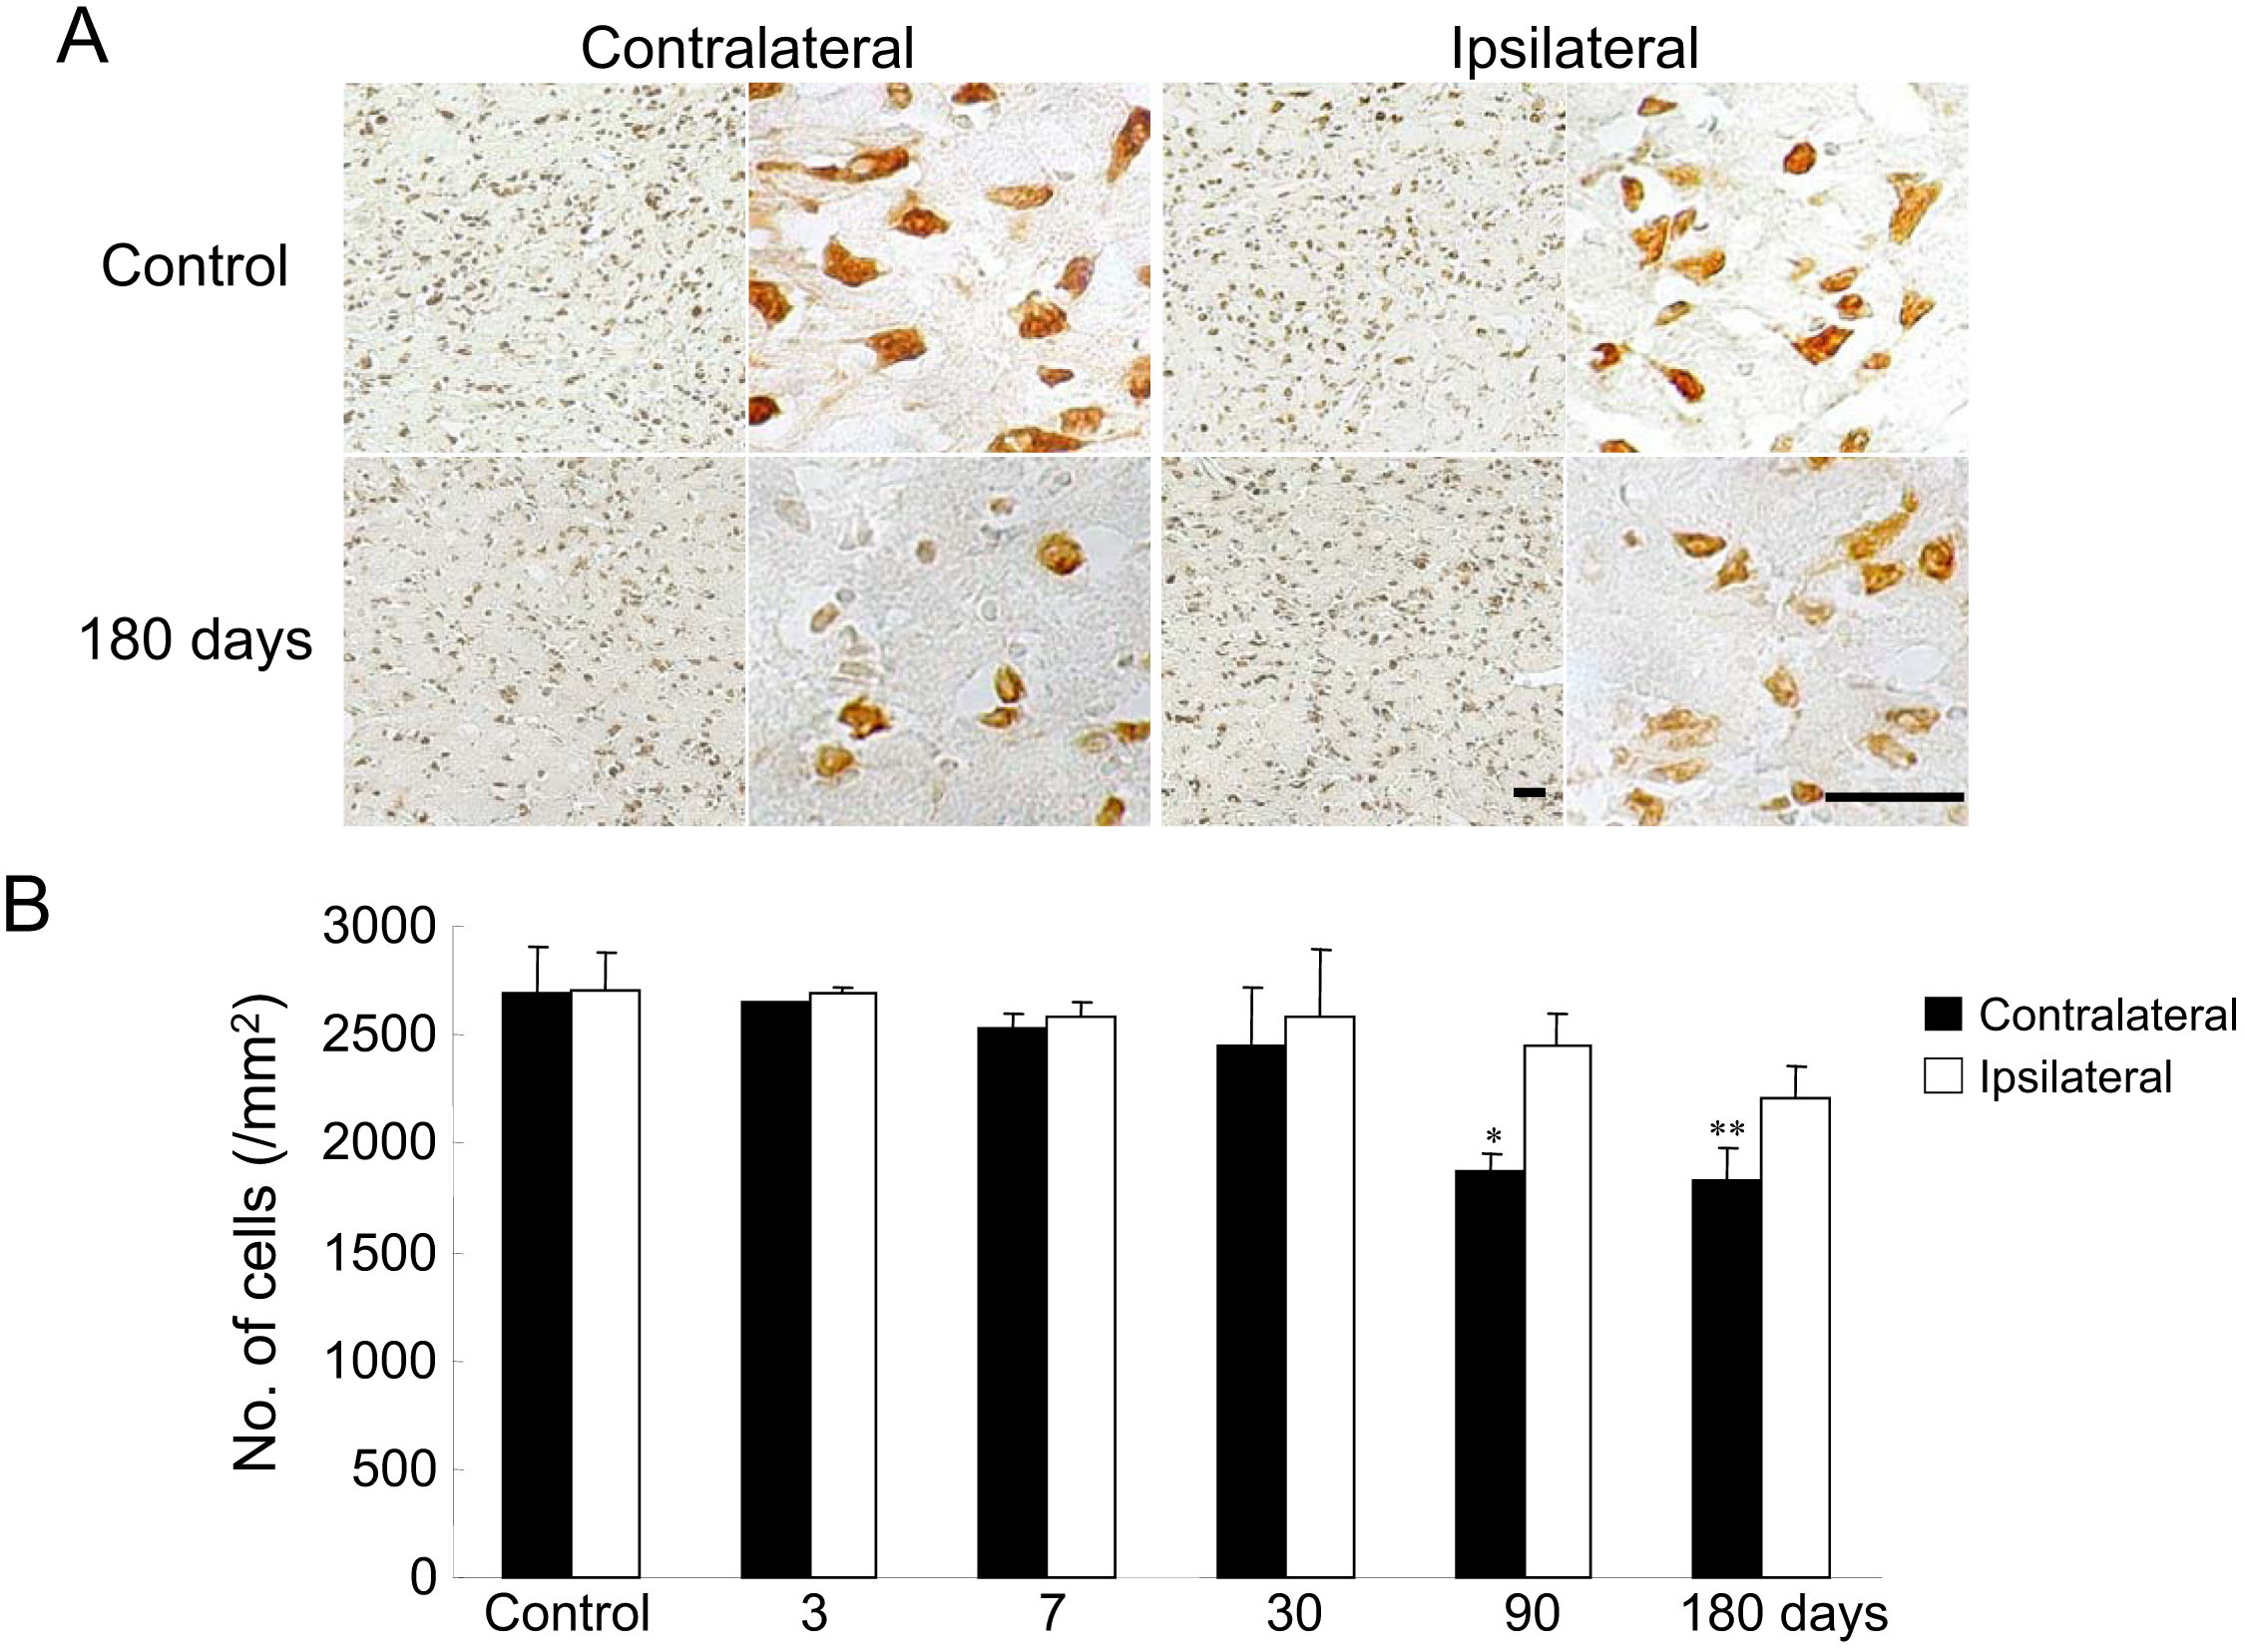
 Figure 2 of Tanaka, Mol Vis 2009; 15:662-669.