Figure 4. The kinetics of regenerative ECs covering the endothelium. A: The percentage of endothelium covered area at different time points after rejection onset is shown in the chart. The area
of recovered endothelium was calculated after one week, three weeks, three months, and six months. From three weeks after
rejection onset, the recovered area reached 100% of the normal level. B: The density and percentage of the regenerative ECs compared with normal cornea is shown in the second chart. The EC density
of a normal DA cornea is 2882/mm2. At the different time points, the density and percentage of the regenerative ECs were calculated. The density of the regenerative
ECs was 32.6% of the normal level at one week after rejection onset, and then gradually improved. However, inconsistent with
the area recovery, the density reached only 55.8% of the normal level up to 6 months after rejection onset.
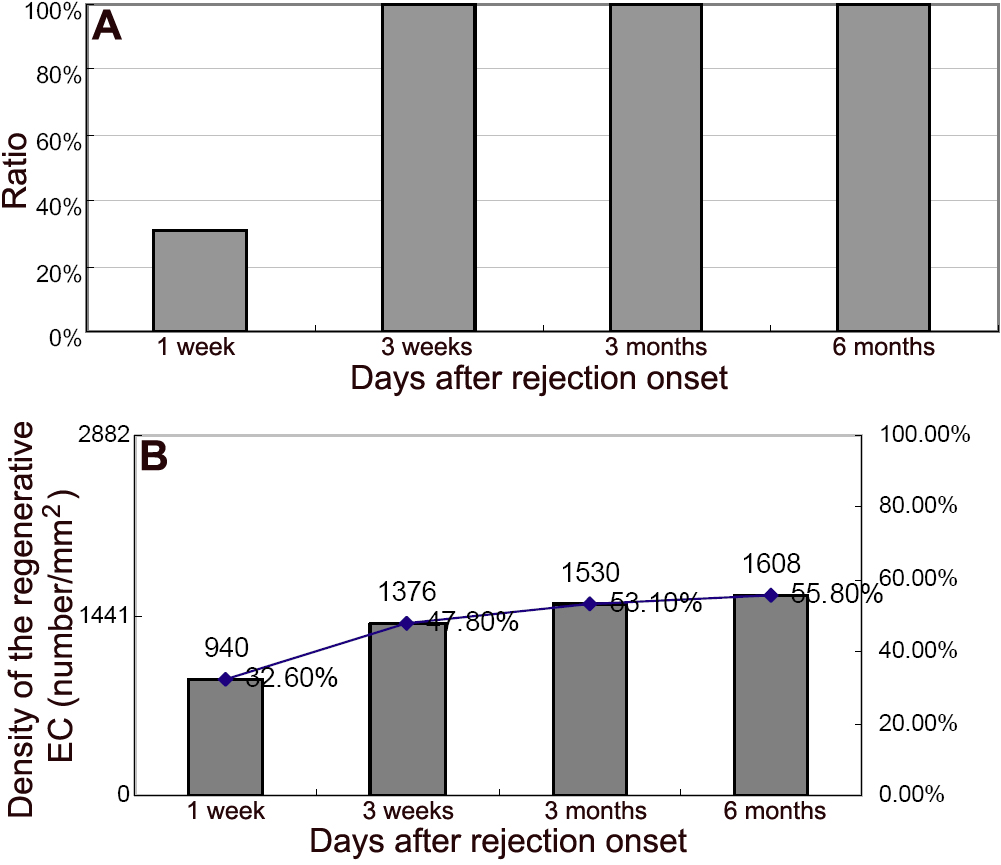
 Figure 4 of
Gong, Mol Vis 2009; 15:654-661.
Figure 4 of
Gong, Mol Vis 2009; 15:654-661.