Figure 3. The process of corneal allograft
EC replacement following rejection. A: The DA corneal allograft
EC staining one week after rejection onset is displayed. ECs were
covering part of the graft endothelium (A1; magnification 100X).
The arrows show that the immigrating cells were crawling across the
suture.ECs were covering part of the graft endothelium (A2;
400X). B: The DA corneal allograft EC staining three weeks
after rejection onset is shown. The whole endothelium was covered by
ECs where the distribution and cell nucleus shape were not as regular
and the cell number was less than the normal level (B1-B3).
The triangle shows a germinal center-like structure (B1,100X; B2:
200X; B3: 400X). The bold arrow shows the cells were growing
radially with an active proliferation state (B4; 100X). C:
The DA corneal allograft EC staining three and six months after
rejection onset is displayed. Three months after rejection onset, a
relatively intact ECs layer is shown, although not yet perfect (C1;
100X). Six months after rejection onset, a relatively intact EC layer
was shown (C2; 100X).
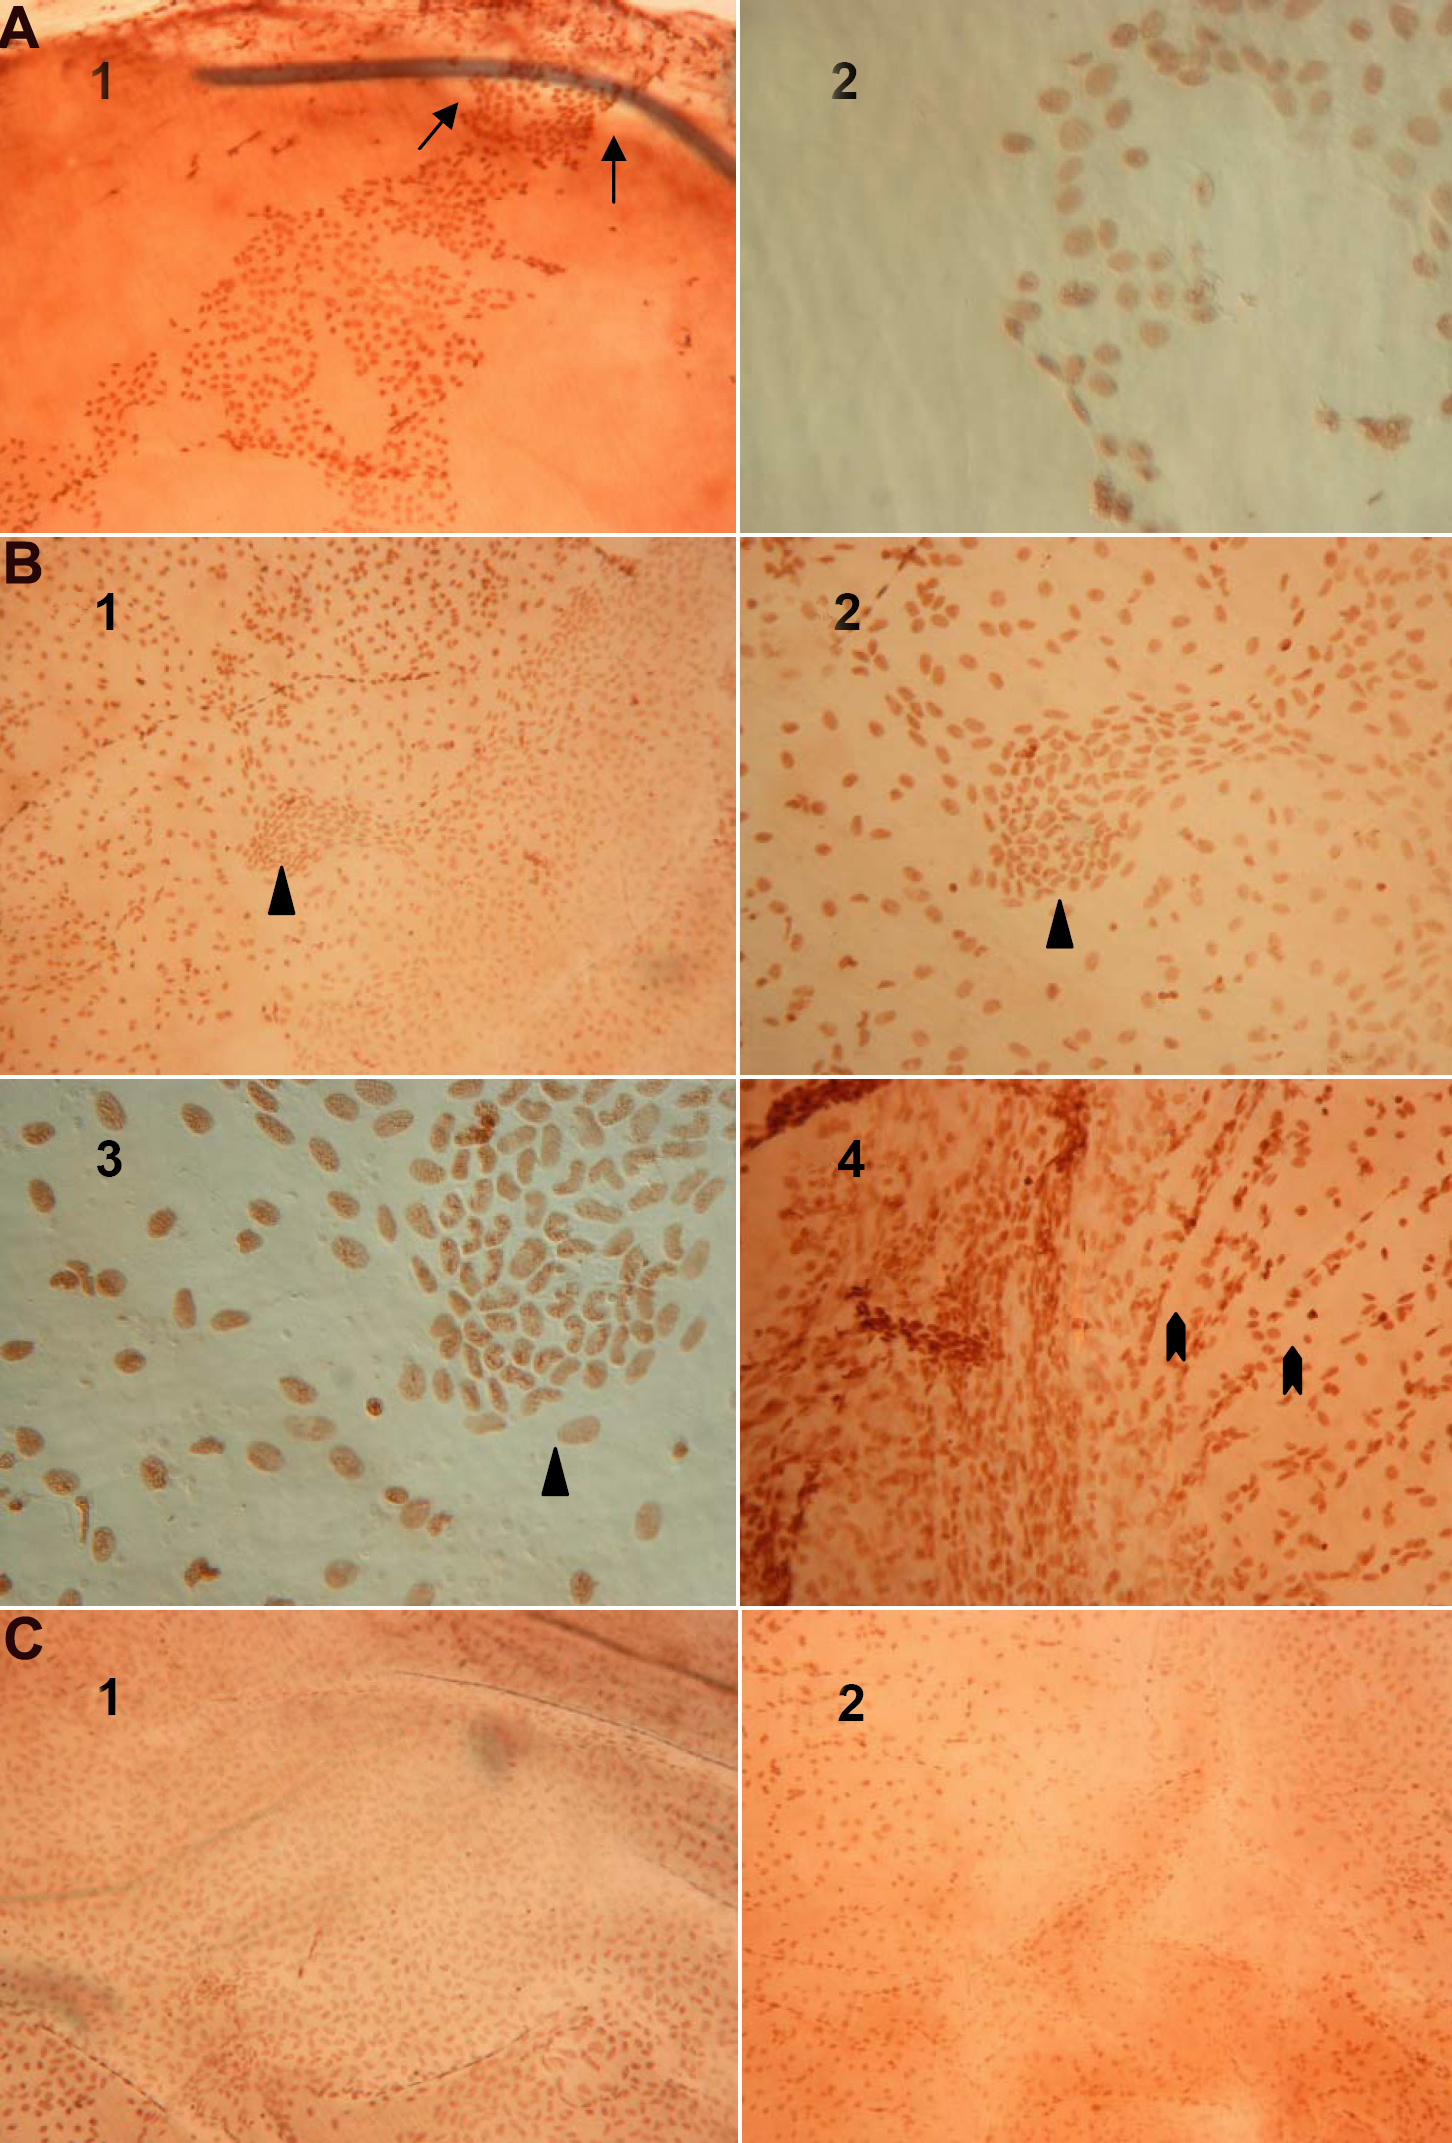
 Figure 3 of Gong, Mol Vis 2009; 15:654-661.