Figure 2. Linkage of the Stargardt family
to ABCA4. The pedigree structure of a family with Stargardt
disease and results from linkage analysis and fine mapping to the ABCA4
locus are shown. Circles denote females, and squares indicate males.
Dark symbols represent affected individuals with Stargardt disease.
Empty symbols are normal individuals. The proband is marked by an
arrow. The gray symbol indicates occurrence of Goldenhar syndrome but
not Stargardt disease. Genotyping results for markers D1S1588,
D1S1170, D1S406, D1S1174, D1S1627, D1S2651, and D1S2726 are
shown under each symbol. Haplotypes were constructed on the basis of
the minimum number of recombinations between markers. The disease
haplotype shared by all affected individuals is denoted by the
blackened vertical bar, and normal haplotype is denoted by an empty
vertical bar. The pedigree information is as in this figure. The
proband is marked by an arrow.
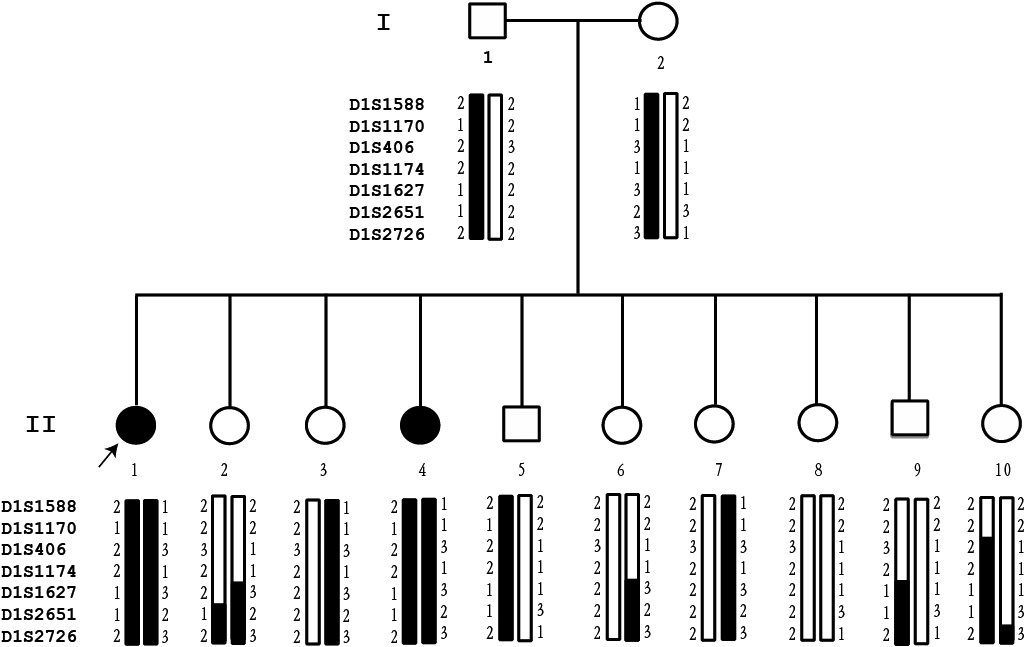
 Figure 2 of Xi, Mol Vis 2009; 15:638-645.