Figure 3. Immunohistochemical studies for
TLR4 in iris whole mounts at different times after LPS injection. The
dynamics of TLR4+ cells in the iris during EIU are shown (A–D).
A: Positive cells could not be detected in the control rats.
Arrows represent blood vessels. B: The TLR4+ cells
possessed pleiomorphic morphology at 6 h. Note the positive cells
(arrowhead) that are located adjacent to blood vessels (arrow). C:
Most of the TLR4+ cells possessed round-ovoid morphology at
24 h (arrowhead). Note the positive cells that are located adjacent to
blood vessels (arrow). D: The TLR4+ cells at 48 h
are shown. The morphology and distribution of the positive cells were
similar to that at 24 h. E: No staining was seen in the iris
when under identical experimental conditions when replacing of the
primary antibody with normal rabbit IgG at the same concentration
(negative control). The arrows indicate blood vessels. F–H:
Double immunofluorescence by confocal microscopy revealed co-expression
(arrow) of TLR4 (green) and CD163 (red) by resident stromal cells in
the iris. I: Positive tissue control shows positive staining
for TLR4 by a subpopulation of macrophage-like cells in the normal rat
spleen. J: A higher power view is shown where the arrow and
arrowheads represent the same cells as in panel I. K:
No staining was seen in the spleen when using identical experimental
conditions but with the replacement of the primary antibody with normal
rabbit IgG at the same concentration (negative control). Original
magnification: B–D,F–H,J 400X; A,E,I,K
200X.
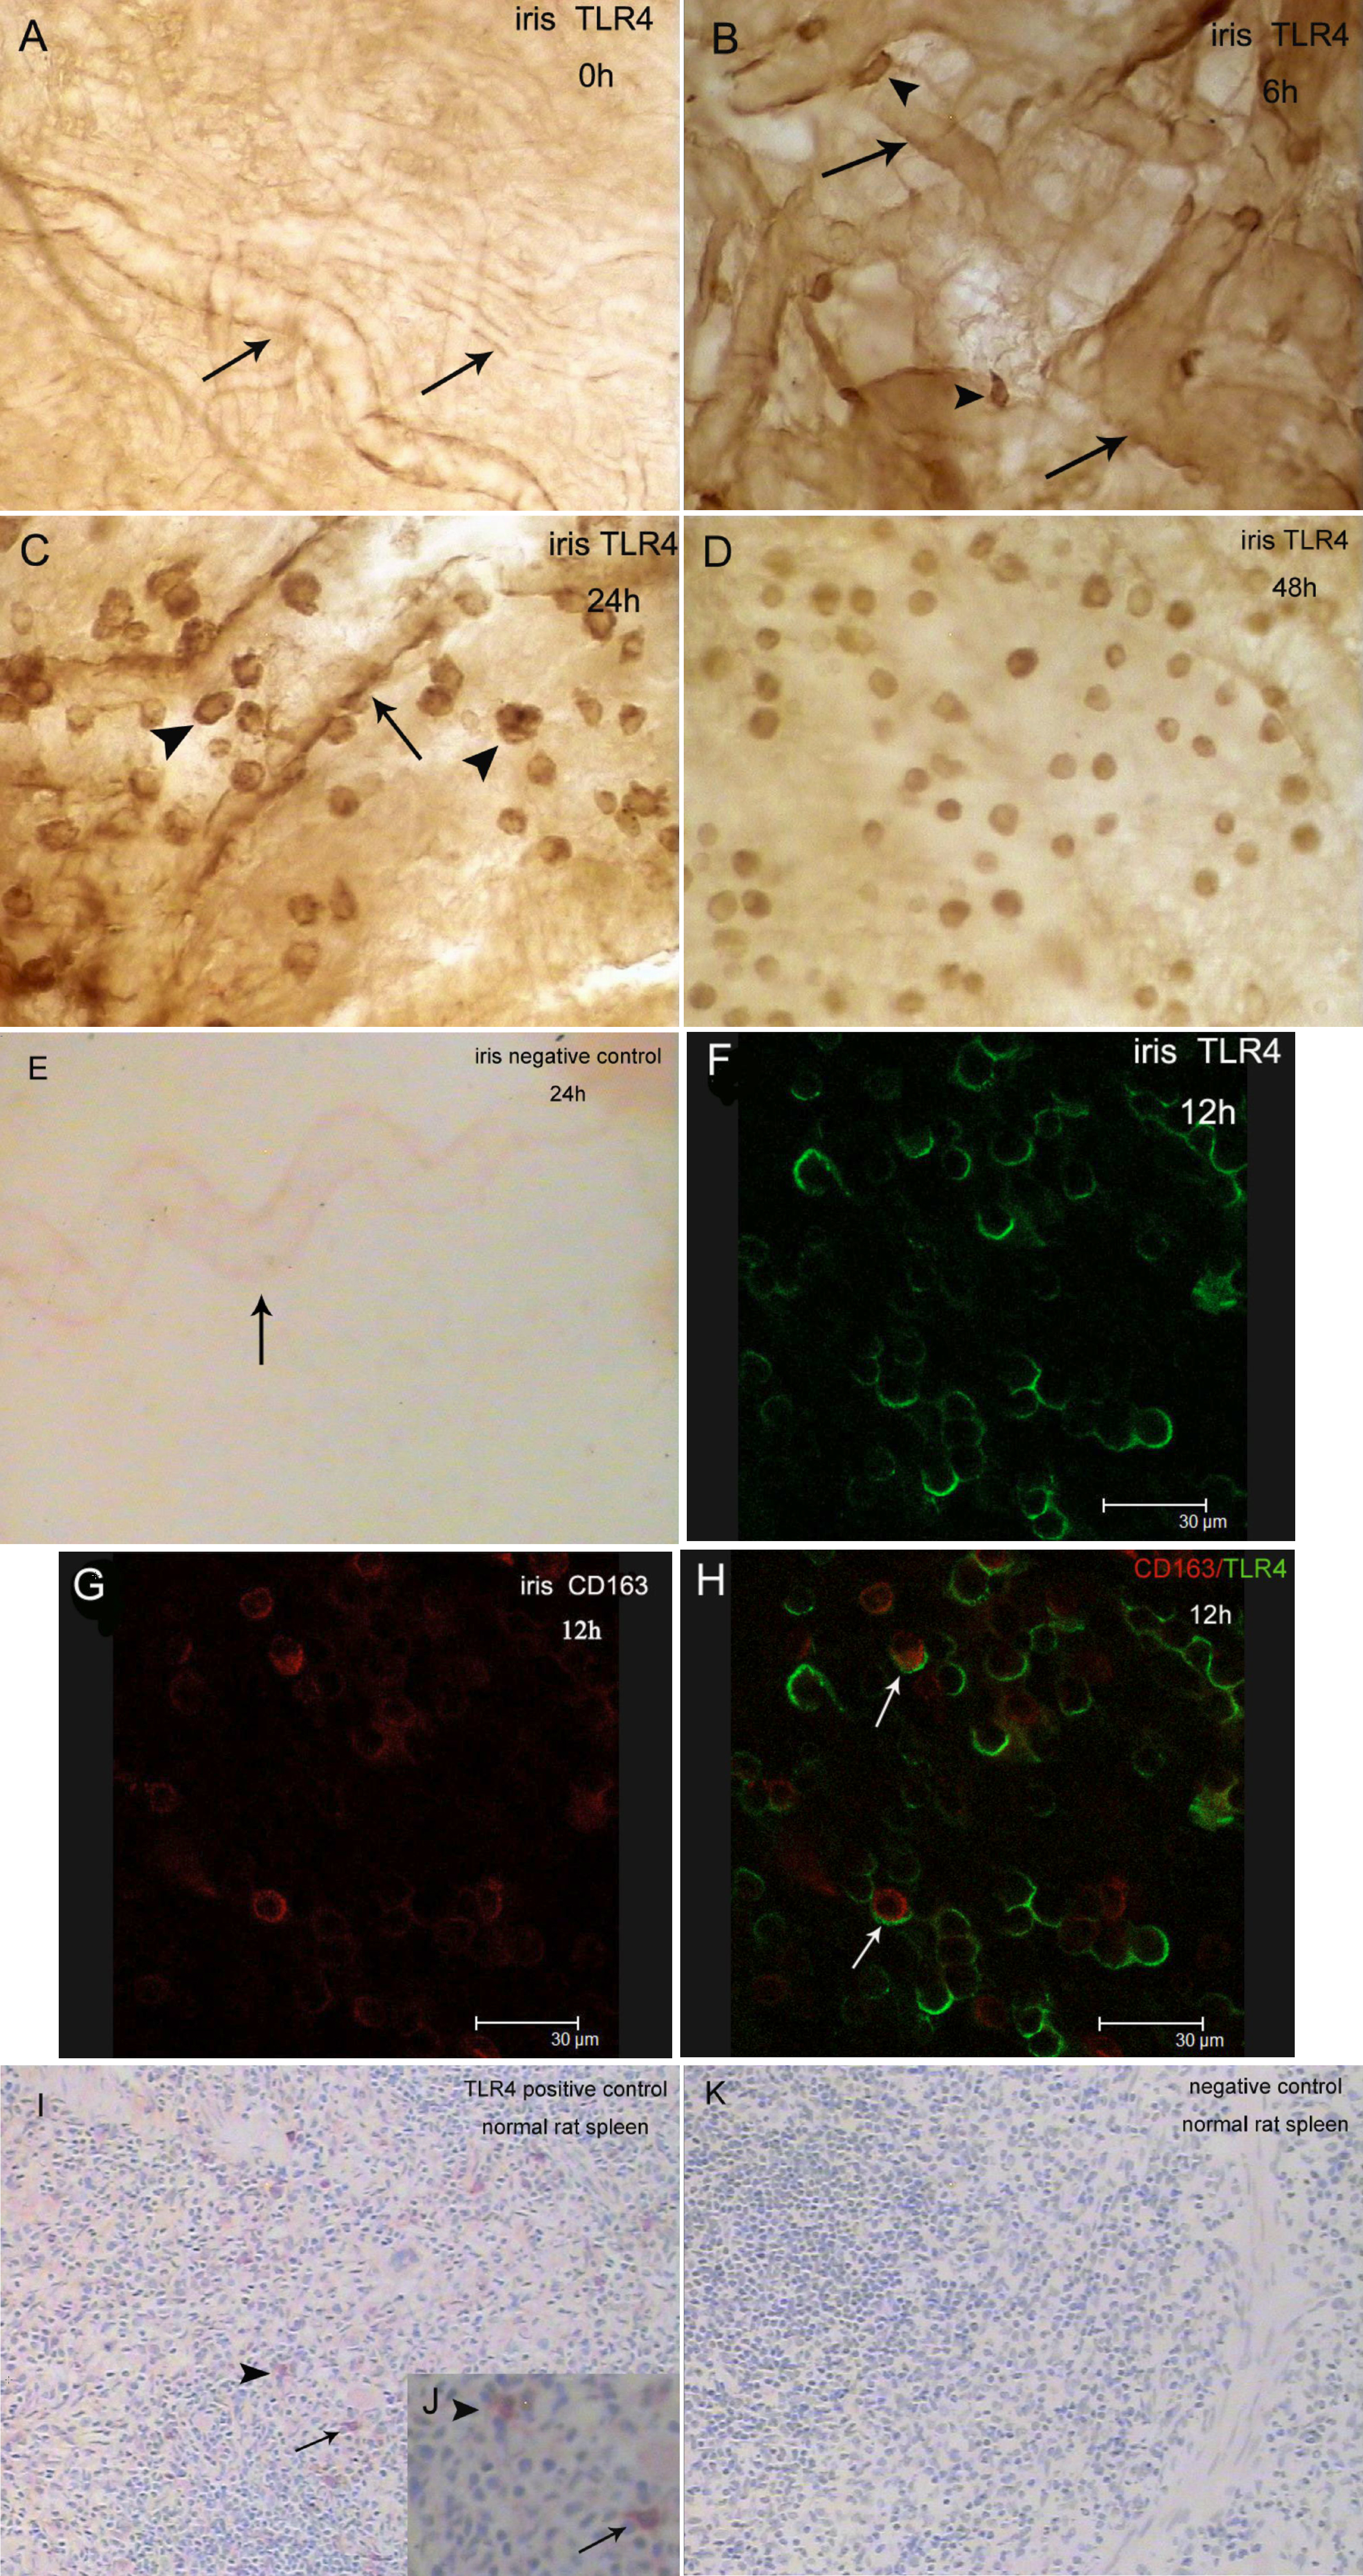
 Figure 3 of Chen, Mol Vis 2009; 15:619-628.