Figure 2. Clinical evaluation and TLR4+
and CD163+ cells in the iris during the course of EIU. A:
The clinical score of EIU and inflammation reached their maximum at 24
h. B: The density of TLR4+ cells in the rat iris had
increased greatly 12 h after injection. C: There are no obvious
changes in the density of CD163+ cells in the rat iris
within 24 h, but the density had increased 48 h after injection. D:
Percentage of round-pleiomorphic CD163+ cells in the rat
iris during the course of EIU is shown in the chart. Significant
differences compared with the controls at a level of p<0.001 are
shown by asterisks.
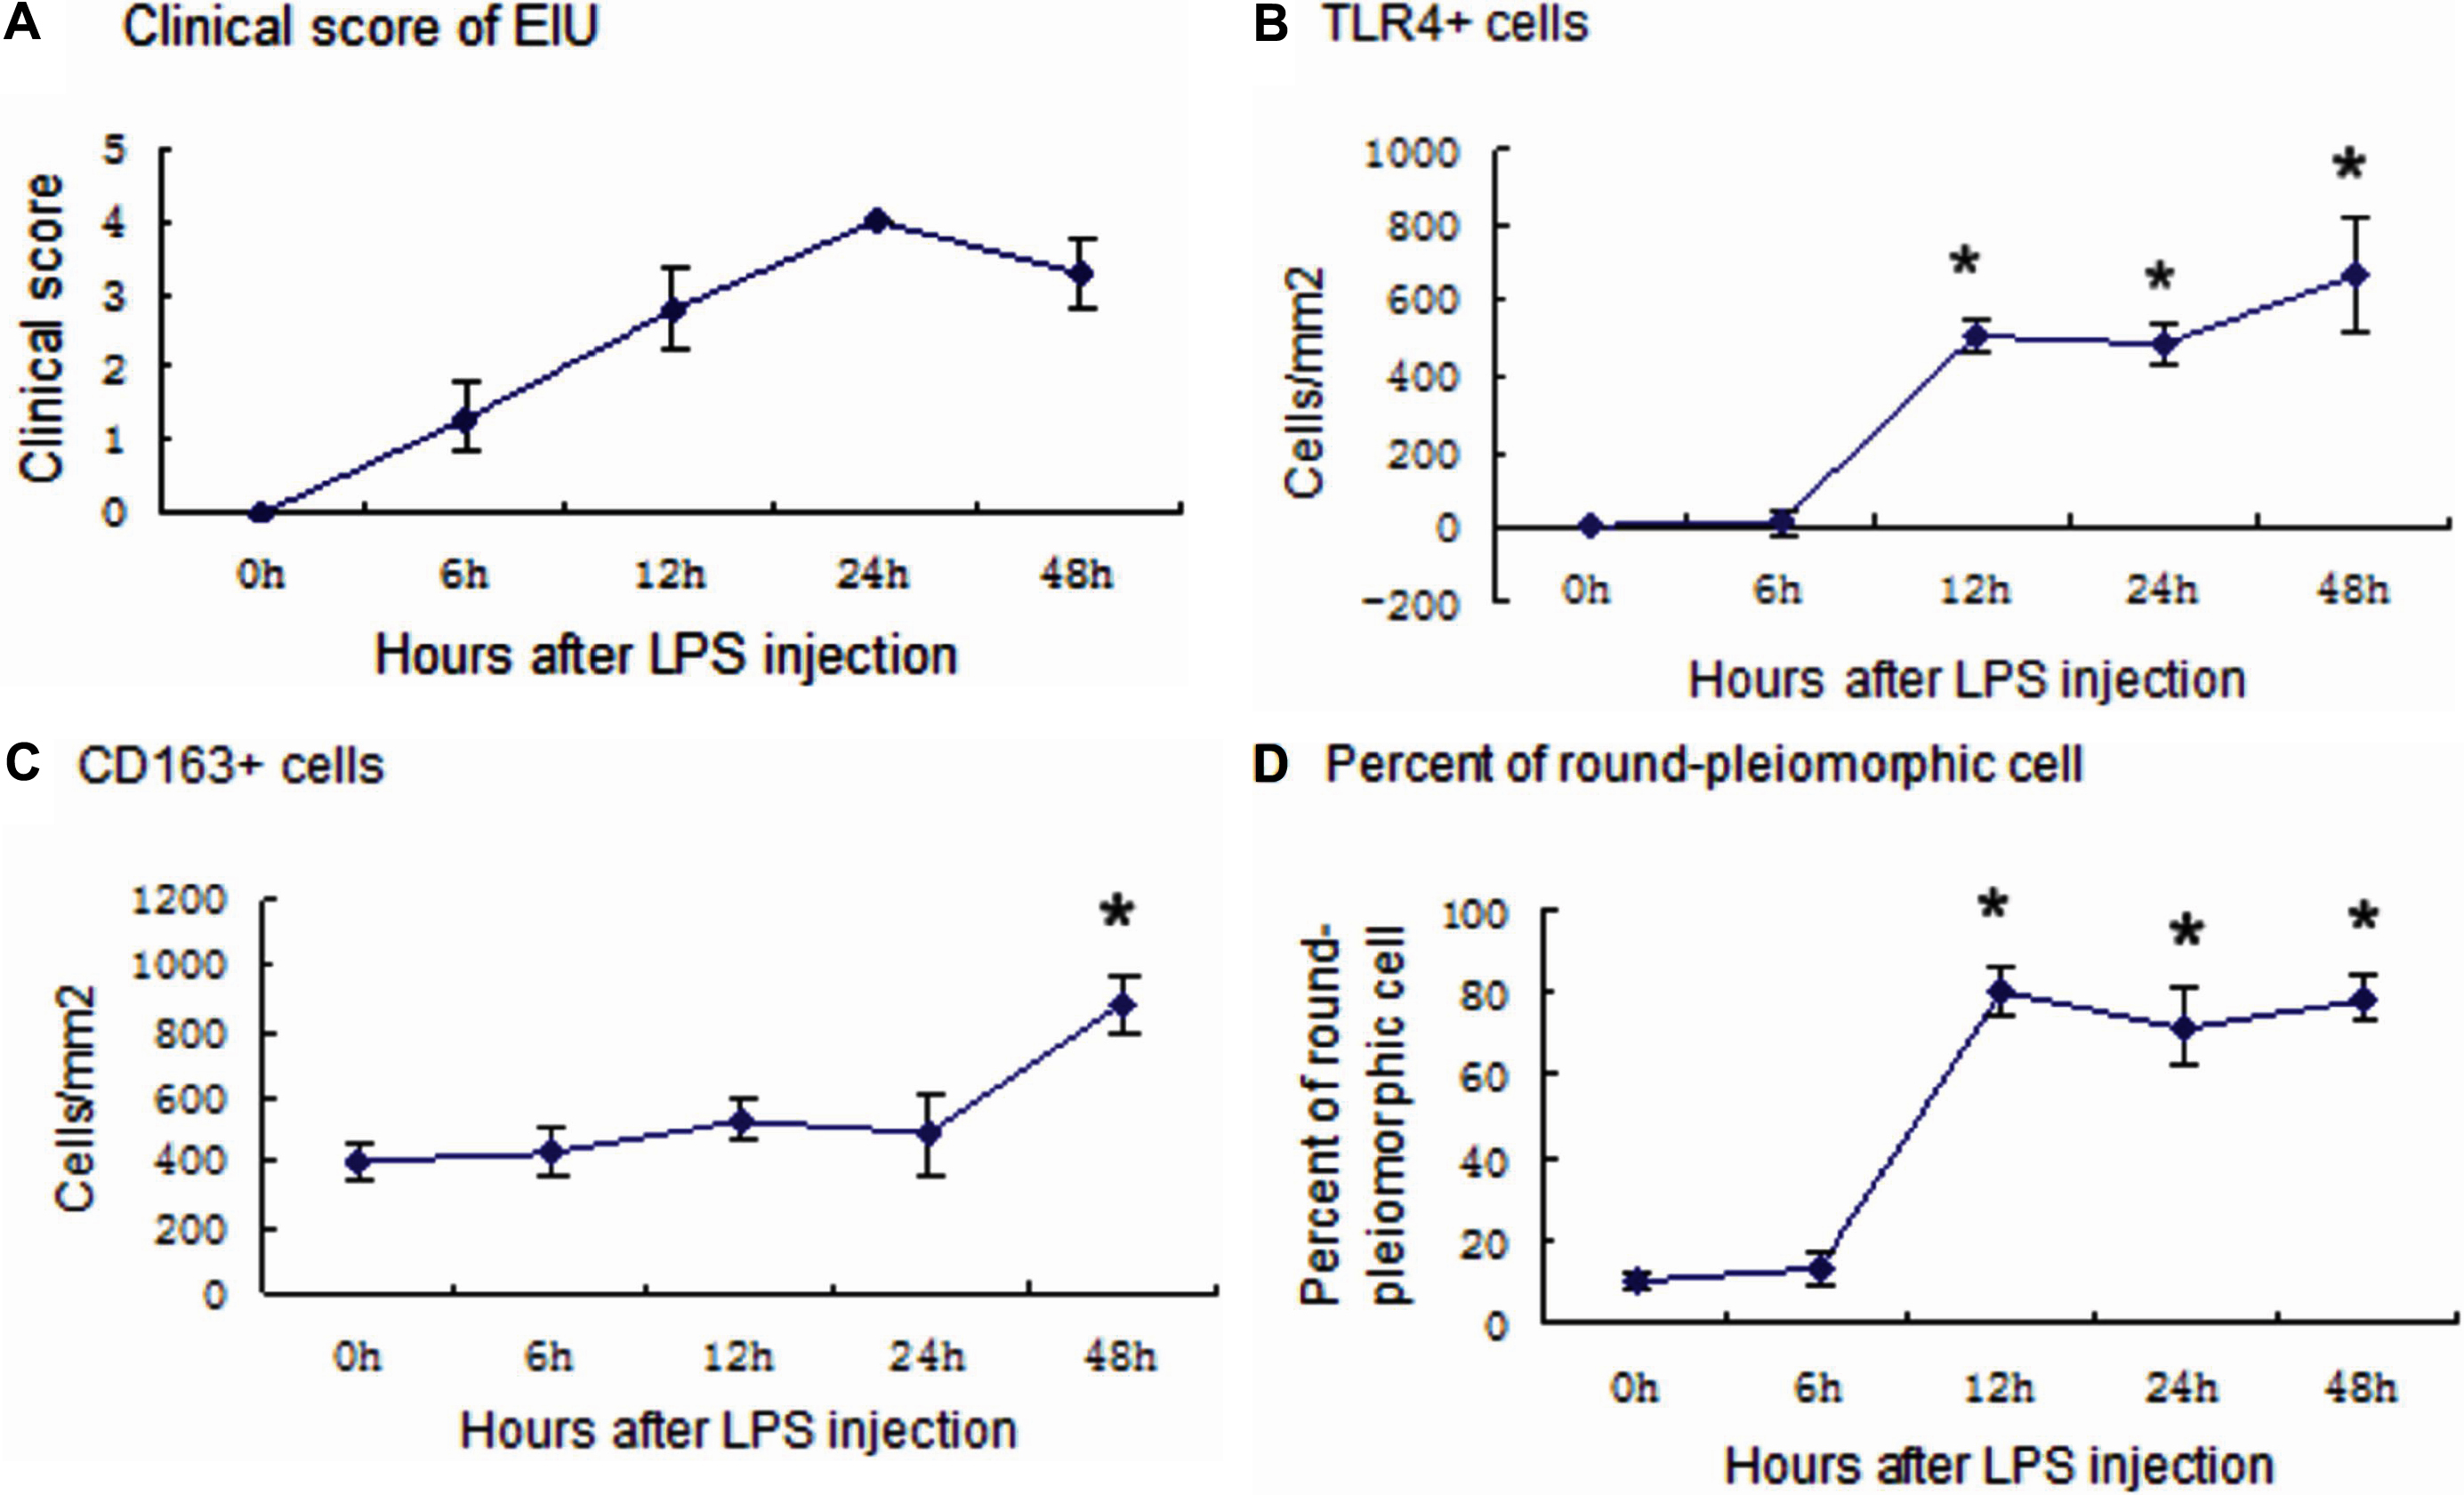
 Figure 2 of Chen, Mol Vis 2009; 15:619-628.