Figure 6 of
Nochez, Mol Vis 2009; 15:598-608.
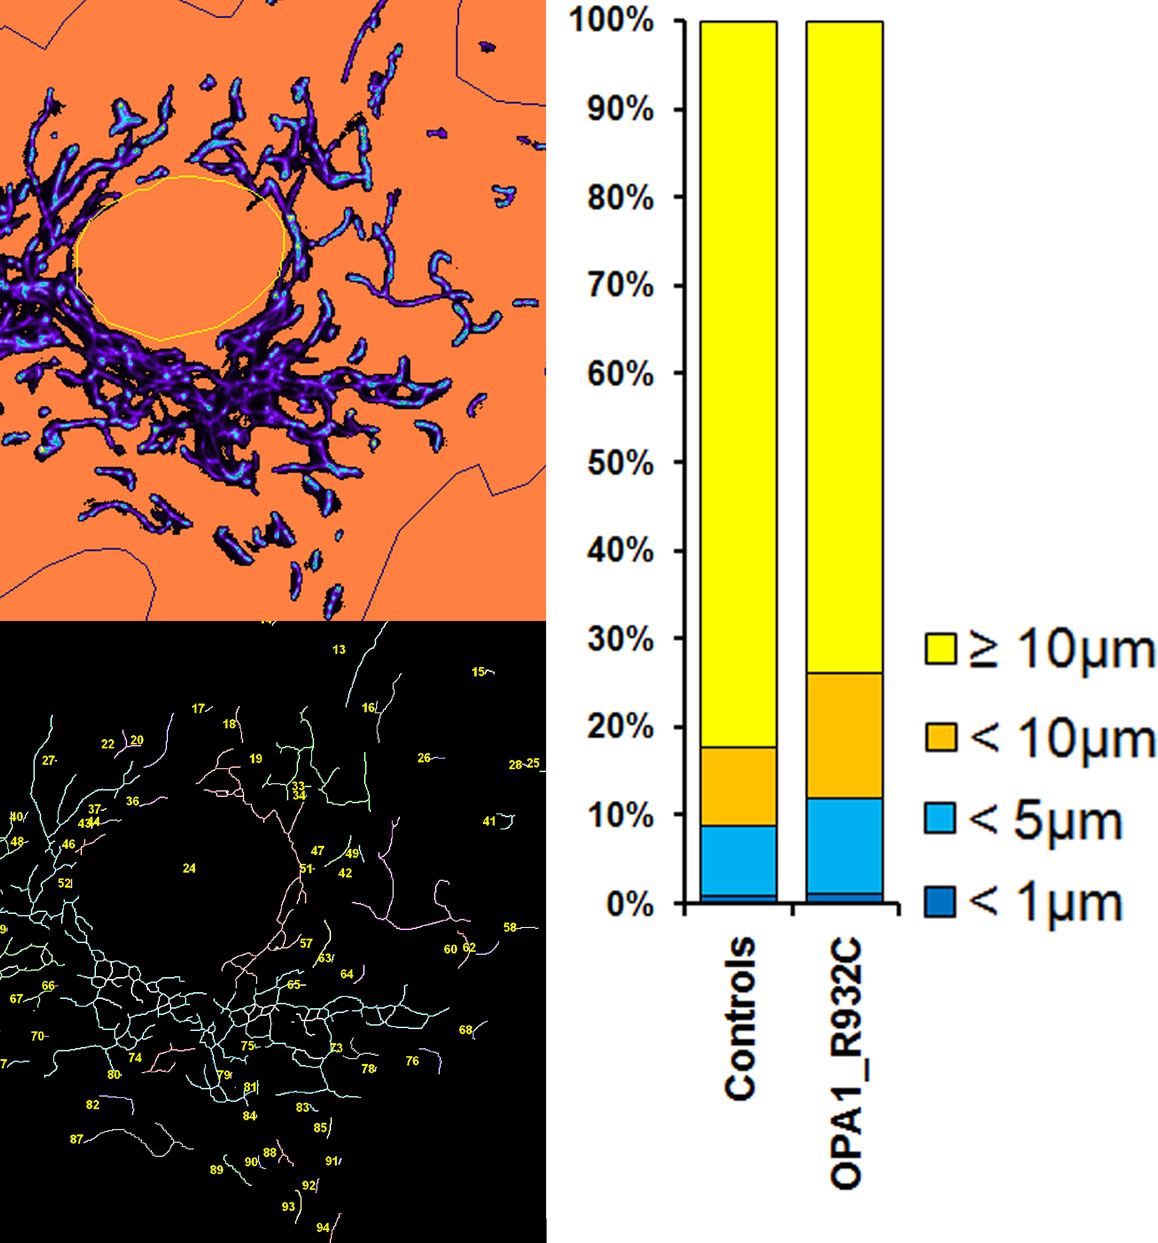
Figure 6.
Quantification of mitochondrial shape showed that the patient’s fibroblasts (OPA1_R932C) contained a higher proportion of short mitochondria than controls (
Appendix 3
).
 Figure 6 of
Nochez, Mol Vis 2009; 15:598-608.
Figure 6 of
Nochez, Mol Vis 2009; 15:598-608.