Figure 1. Relative telomere lengths in
Pro23His RP patients. Boxplot showing no difference in T:S ratio’s
between patients with high- or low ERG amplitudes. The shaded boxes
indicate the interquartile range. The horizontal line in each shaded
box denotes the median, and the error bars mark the upper and lower 95
percentiles of the T:S ratio.
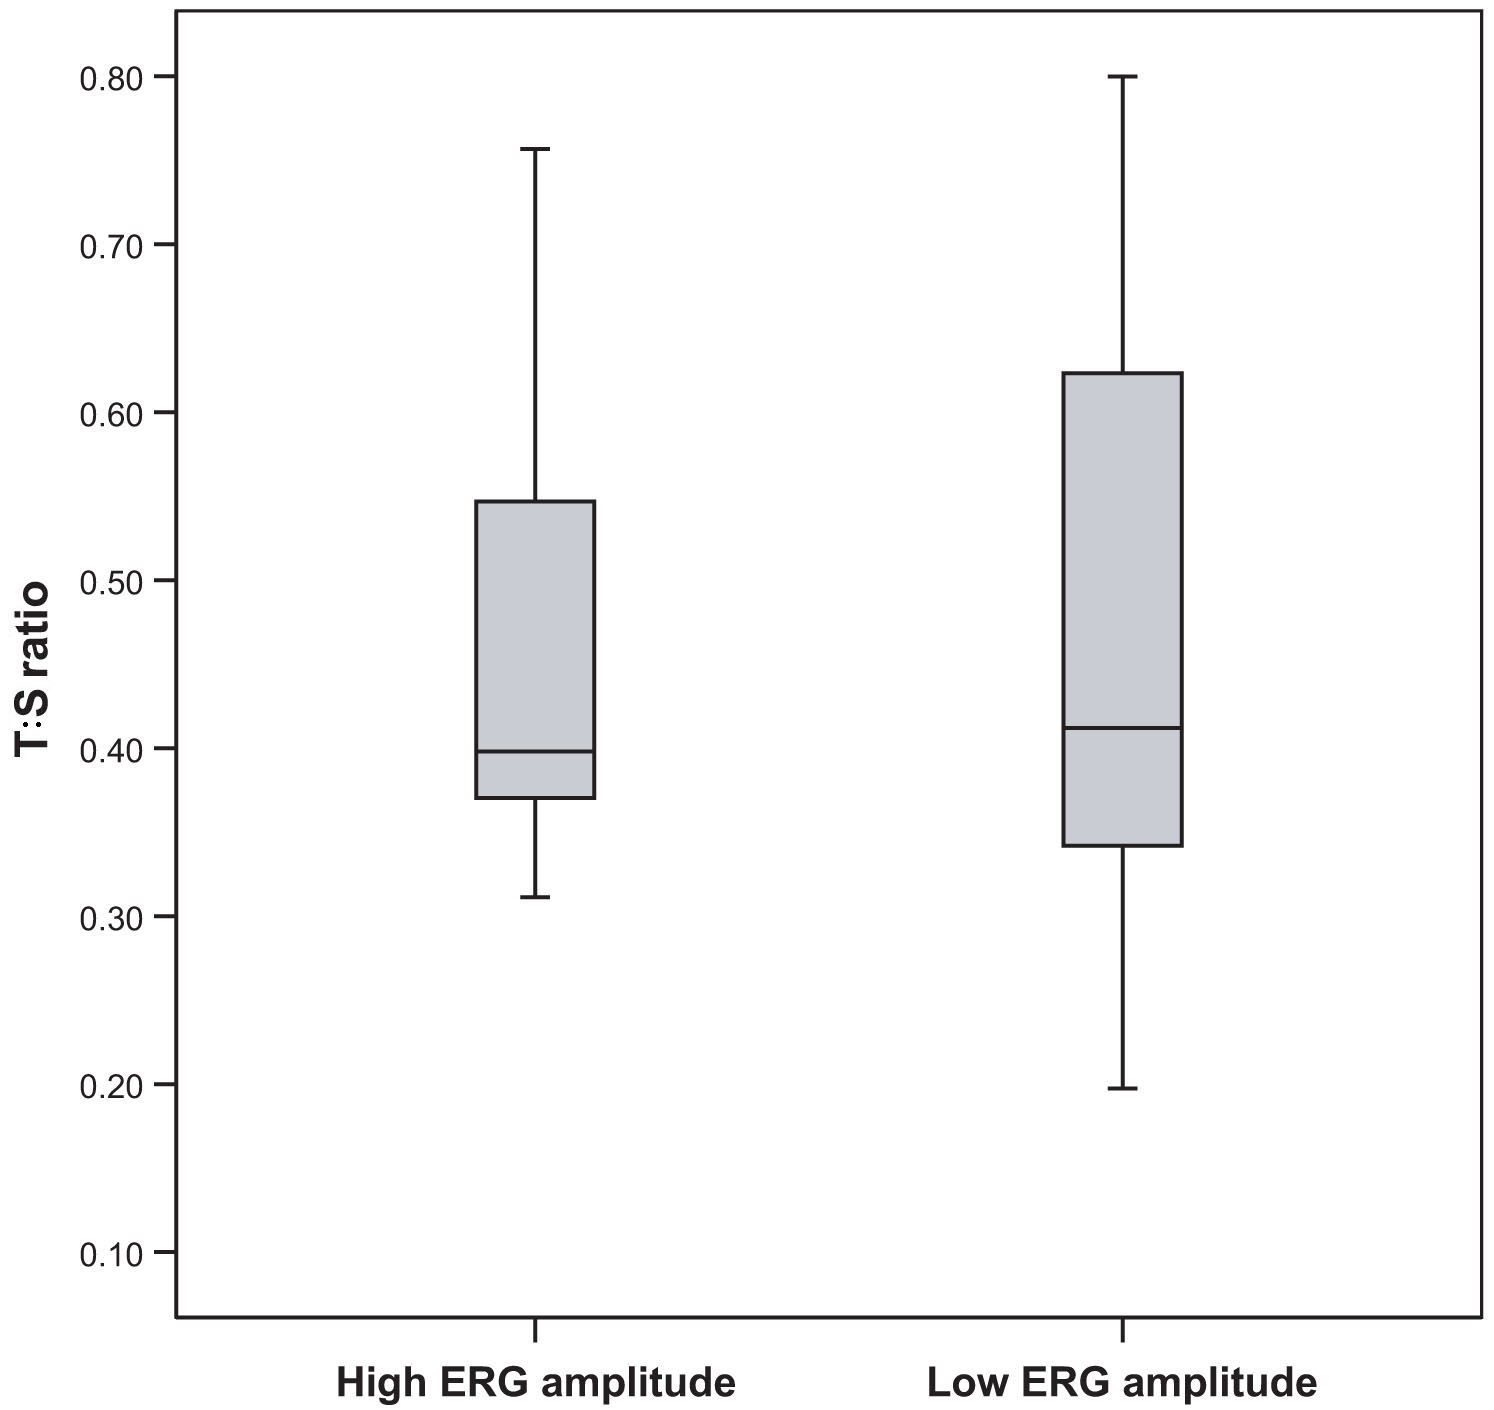
 Figure 1 of Hartong, Mol Vis 2009; 15:592-597.