Figure 4. Distribution by disease biomarkers in order of significance and their perturbation in diabetics. This figure shows disease
biomarkers in order of significance and their perturbation in diabetics. As expected in diabetes, biomarkers for vascular
disease, ischemia and infarction showed perturbation. The set of common analytes to both experiments is marked as blue/white
stripes. The unique analytes are marked as colored bars (orange=diabetic, blue=normal/non-diabetic).
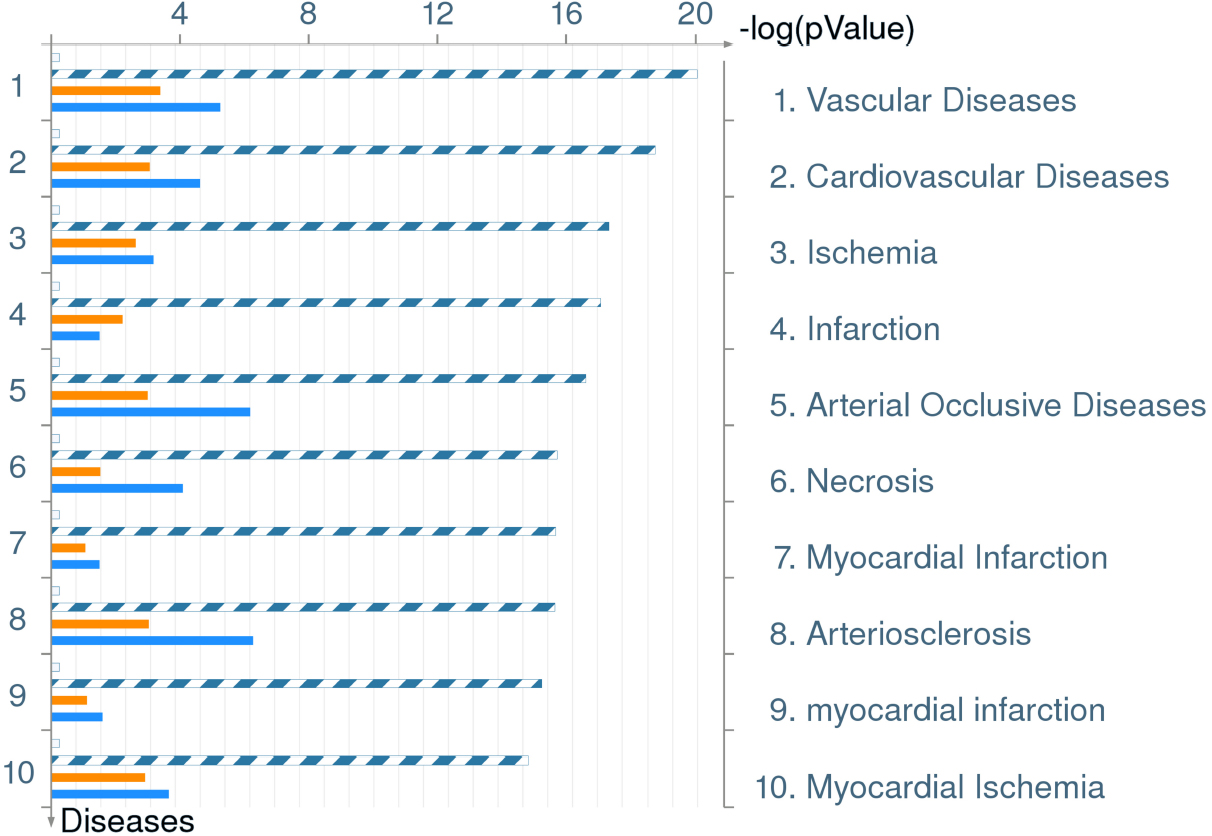
 Figure 4 of
Sharma, Mol Vis 2009; 15:60-69.
Figure 4 of
Sharma, Mol Vis 2009; 15:60-69.