Figure 2. Distribution by canonical pathway maps in order of significance and their perturbation in diabetics. This figure shows canonical
pathway maps, in order of significance and their perturbation in diabetics. Relevant to diabetes, the immune response and
cell adhesion pathways were notably perturbed. Some pathways have been worked out in mouse cells and this is noted. The set
of common analytes to both experiments is marked as blue/white stripes. The unique analytes are marked as colored bars (orange=diabetic,
blue=normal/non-diabetic).
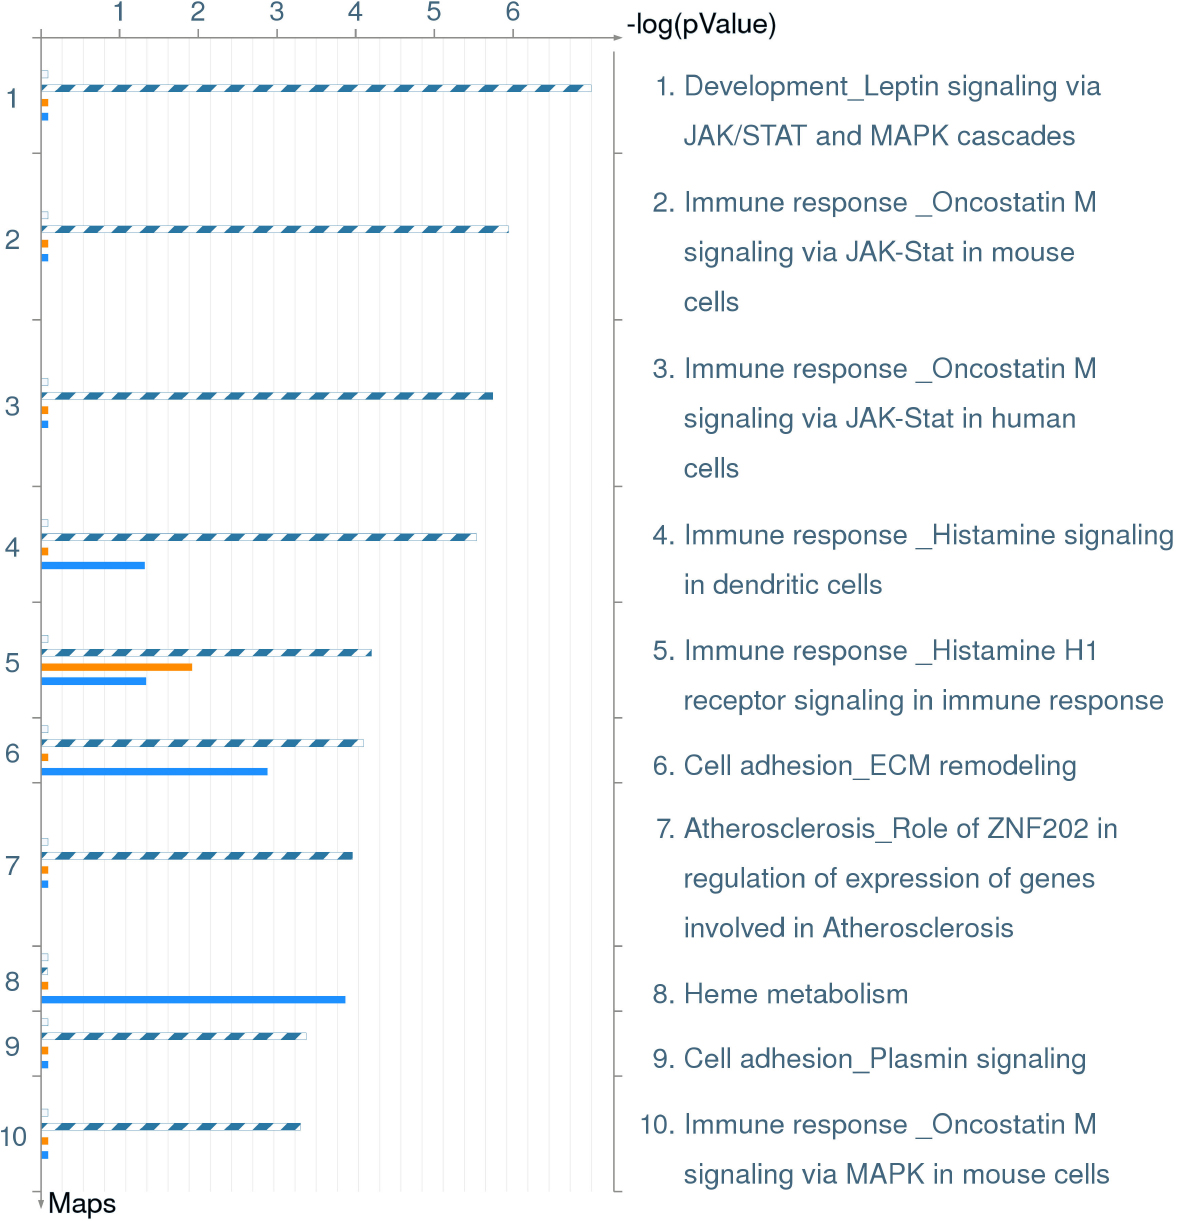
 Figure 2 of
Sharma, Mol Vis 2009; 15:60-69.
Figure 2 of
Sharma, Mol Vis 2009; 15:60-69.