Figure 1. List of analytes that showed a
twofold or more change in their levels in diabetic aqueous samples when
compared to non-diabetic samples. The figure shows analytes that showed
significant difference (2 fold or more; abscissa) between normal and
the diabetic
aqueous. The most prominent decrease was observed in glutathione
S-transferase, and an increase in fibrinogen.
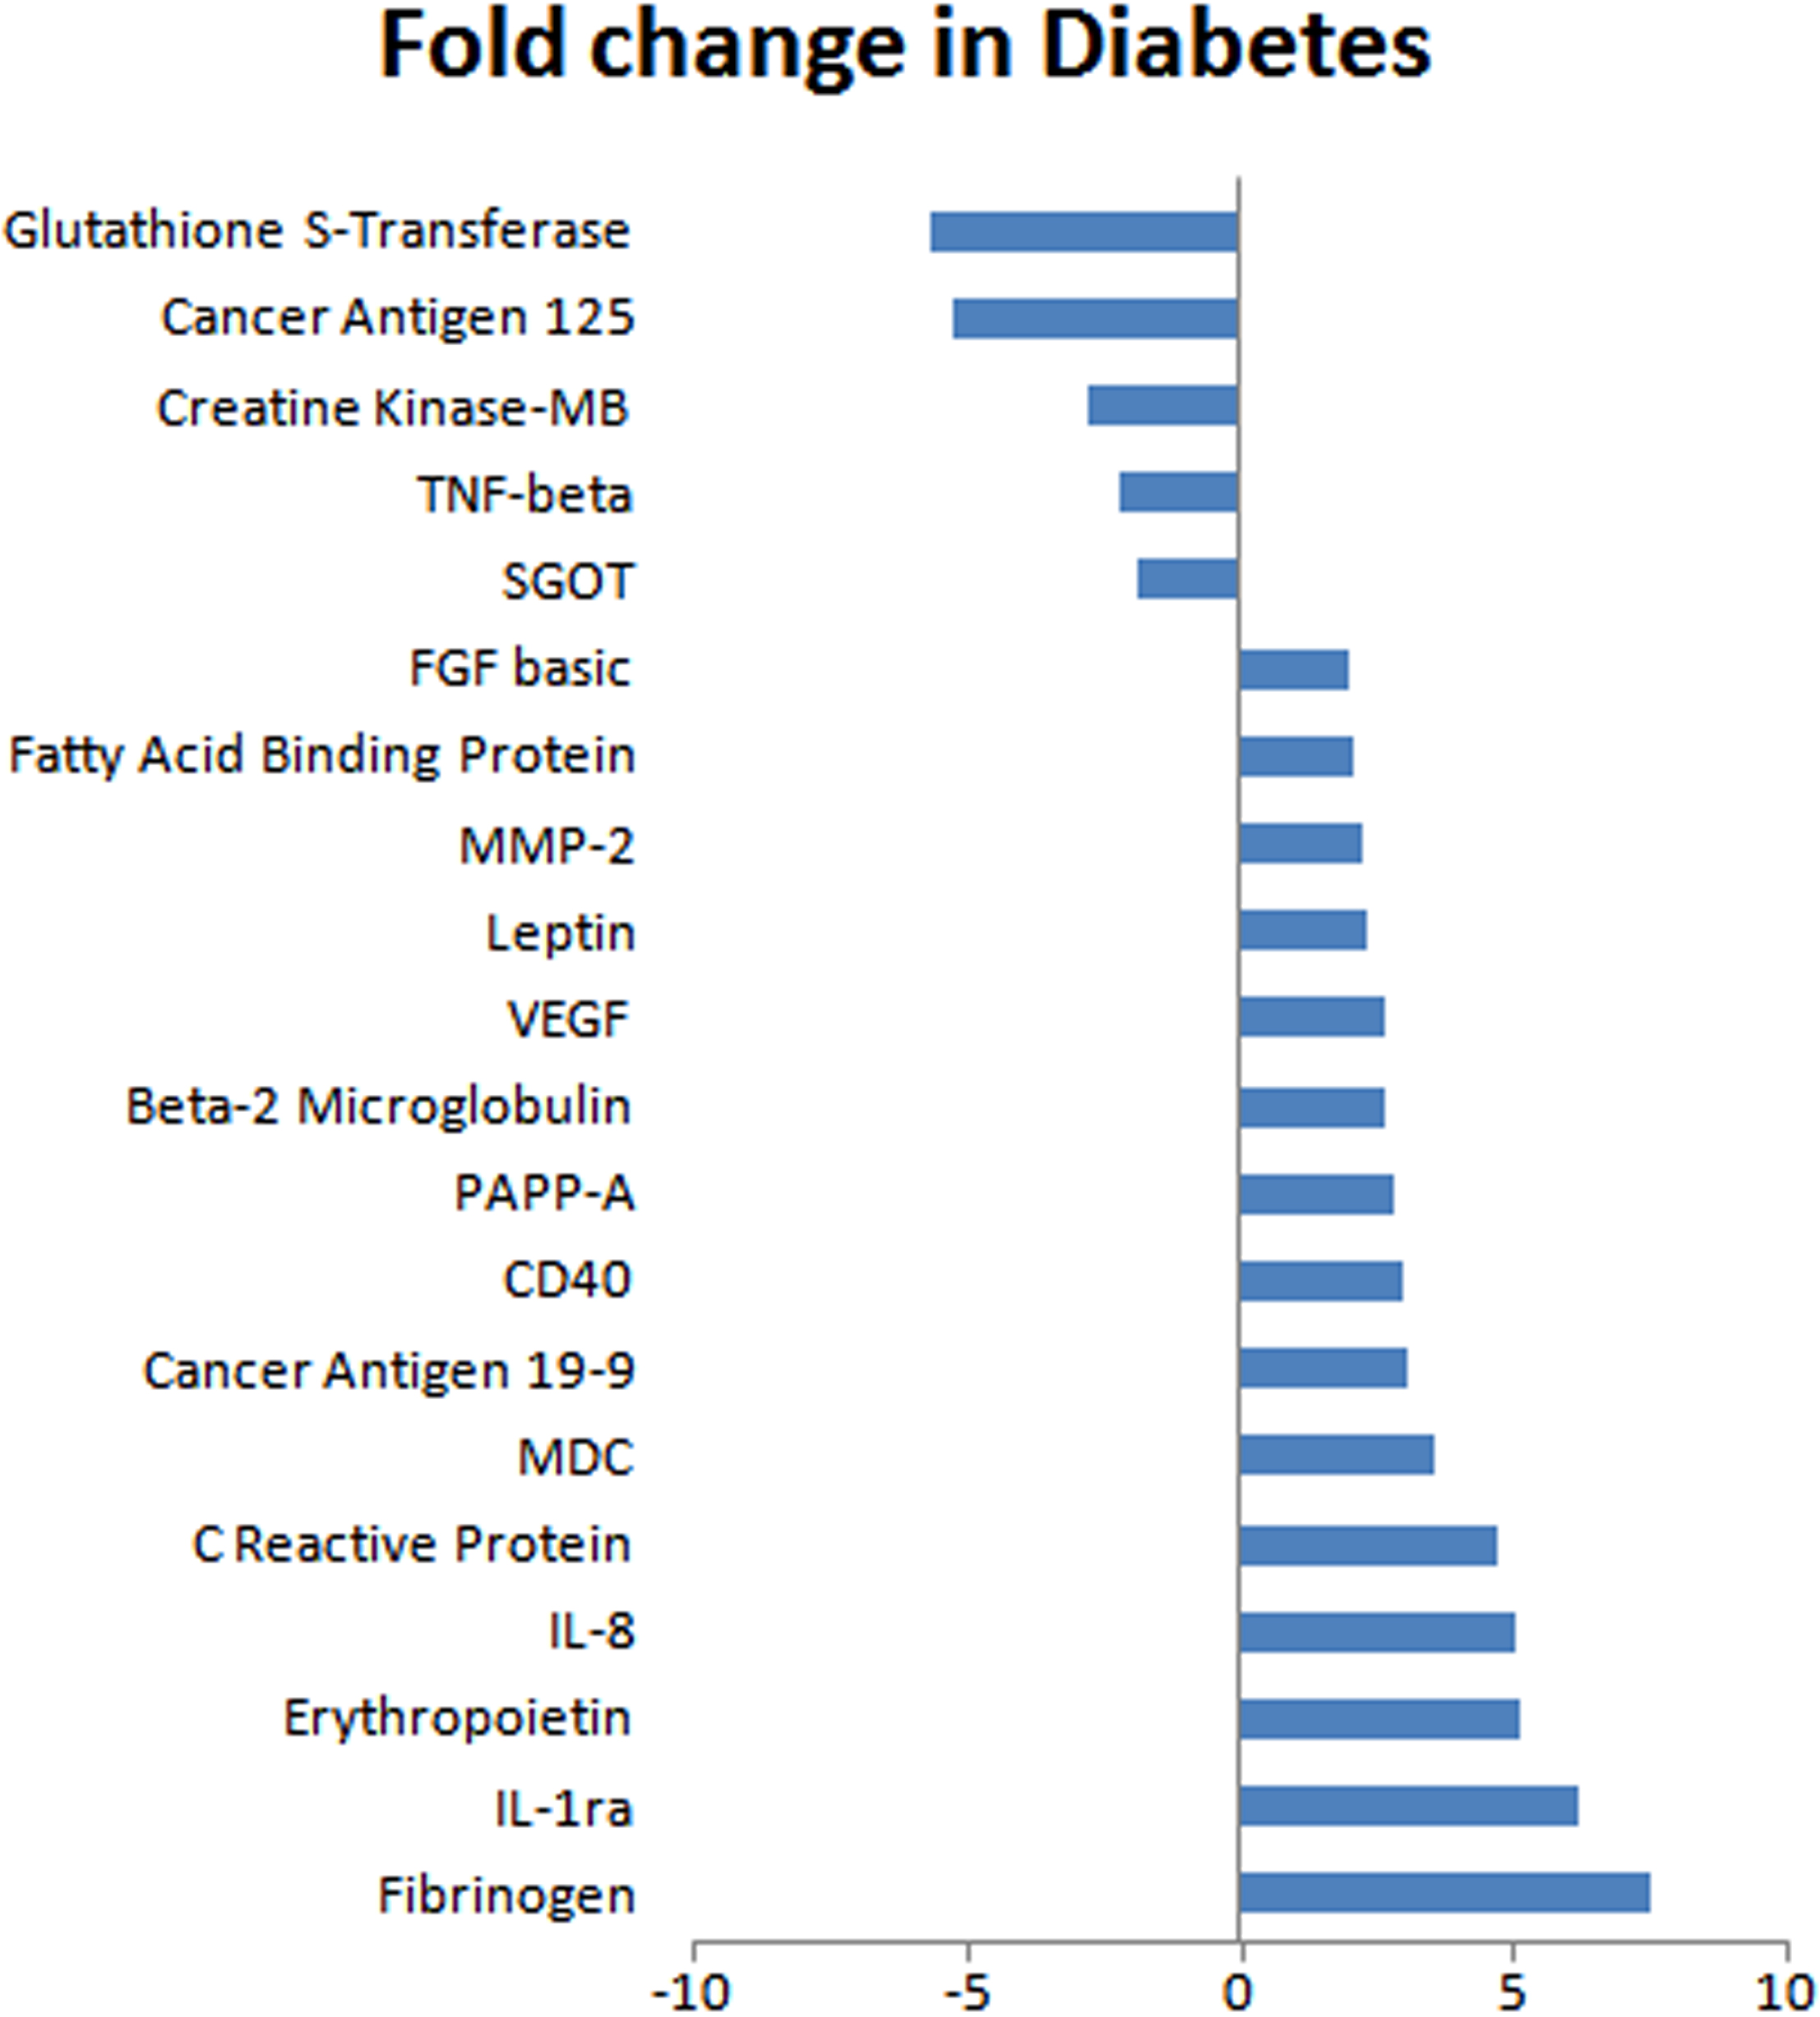
 Figure 1 of Sharma, Mol Vis 2009; 15:60-69.