Figure 4. Analysis of 8-oxo-dG levels and p53 phosphorylation. HCE cells were incubated with PBS (clear square) or HMW-HA (black square)
and irradiated with various doses (0, 25, 75, and 150 mJ/cm2) of UVB. The concentration of 8-oxo-dG excreted in the cell culture supernatant and quantification of serine 46-phosphorylated
p53 were determined by ELISA 24 h after irradiation. A: The concentration of 8-oxo-dG excreted in the cell culture supernatant and B: quantification of serine 46-phosphorylated p53 were determined by ELISA 24 h after irradiation.Data are mean±SD of three
independent experiments. Differences were significant at p<0.05 (one asterisk), p<0.01 (two asterisks), and p<0.001 (three
asterisks) compared to the PBS group of each UVB dose.
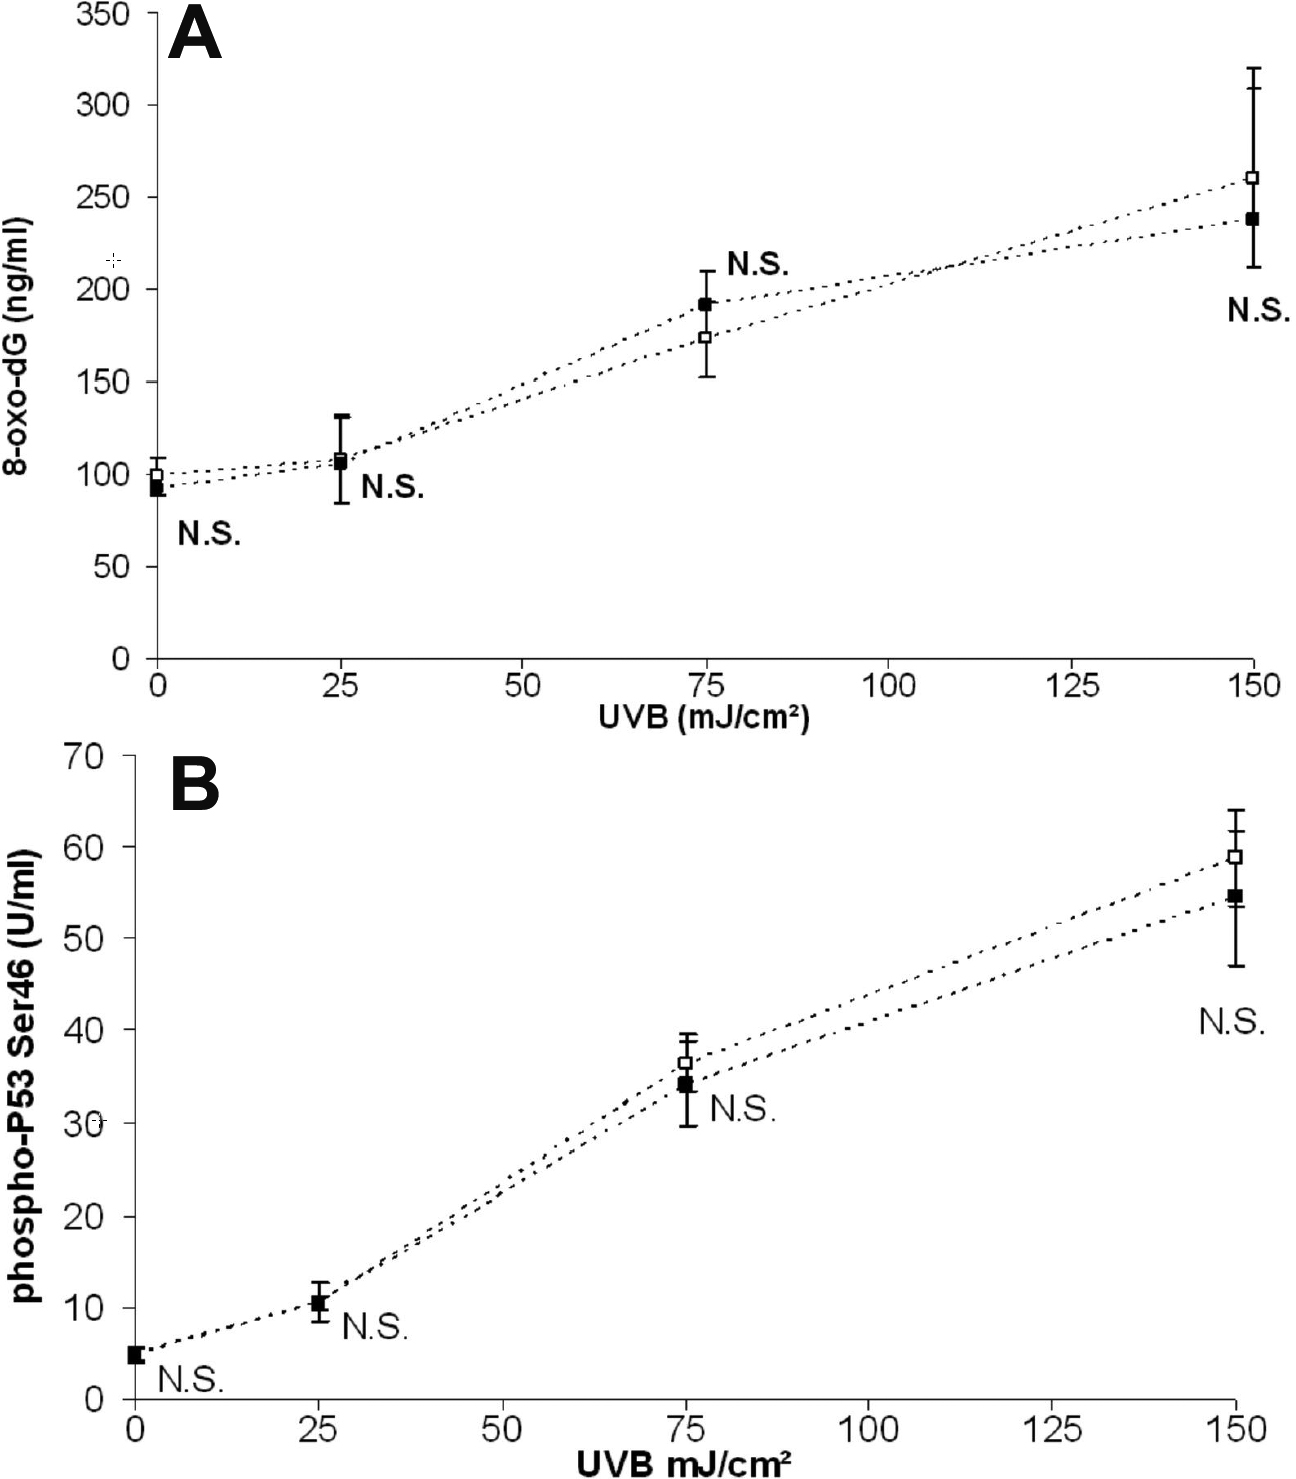
 Figure 4 of
Pauloin, Mol Vis 2009; 15:577-583.
Figure 4 of
Pauloin, Mol Vis 2009; 15:577-583.