Figure 2. Analysis of intracellular ROS and GSH levels following UVB irradiation. HCE cells were incubated with PBS (clear square) or
HMW-HA (black square) and irradiated with various doses (0, 25, 75, and 150 mJ/cm2) of UVB. The intracellular ROS level (A) was measured with a H2DCF-DA fluorogen probe, and the intracellular GSH level (B) was measured with a monochlorobimane fluorogen probe after UVB irradiation. Results are expressed as mean±SD of three independent
experiments. Differences were significant at p<0.05 (one asterisk), p<0.01 (two asterisks), and p<0.001 (three asterisks)
compared to the PBS group of each UVB dose.
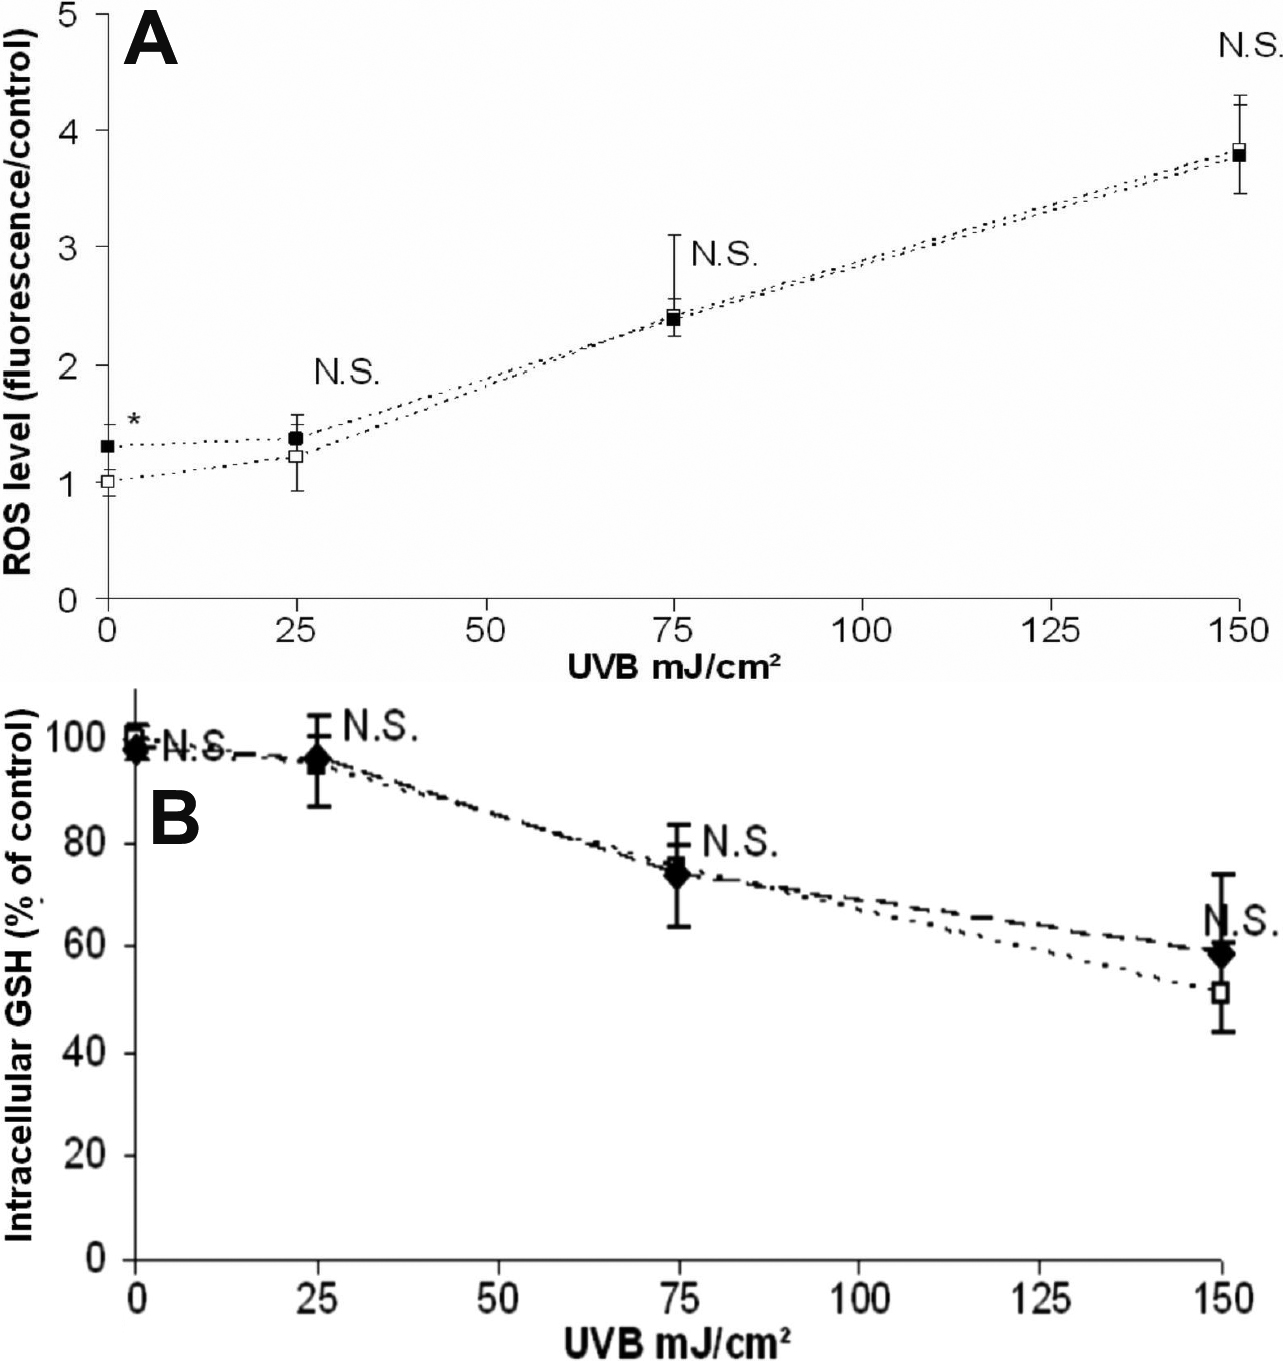
 Figure 2 of
Pauloin, Mol Vis 2009; 15:577-583.
Figure 2 of
Pauloin, Mol Vis 2009; 15:577-583.