Figure 7. Immune cell infiltration of the
ocular surface predicts corneal SPRR1B expression. For each of the 12
subfigures, we plotted SPRR1B as fluorescent intensity on the y-axis in
arbitrary units while immune cell counts (CD4, CD8, CD11c, and I-Ad)
are plotted on the x-axis in three different locations (Co, cornea; Lm,
limbus; Cj, conjunctiva). Each graph shows raw observations (open
circles) as well as a regression line. Each regression line was fit
using ordinary least squares to ensure the validity of statistical
tests with respect to normality. In order to minimize highly
influential points, we transformed both X and Y using the cube root and
logarithm, respectively. Curvilinear graphs appear when the regression
model is transformed back to the original scale. Centered quadratic
terms were included only when statistically significant at the 0.05
level, which only occurred for CD8 cells in the conjunctiva, row 2,
column 3. Significant p values (shown in blue) were computed to test
the null hypothesis that SPRR1B did not depend on each of the 12 immune
cell counts. Note that these p values were adjusted for multiple
comparisons using the Holm method. Squared multiple correlation
coefficients indicate the fraction of the variance explained by the
regression model. The most compelling predictors of corneal SPRR1B were
corneal I-Ad+ cells (two stars) and limbal CD11c+
cells (one star). CD4+ and I-Ad+ immune cells in
limbus as well as generalized presence of immune cells in the
conjunctiva also showed strong and statistically significant
relationships to SPRR1B expression.
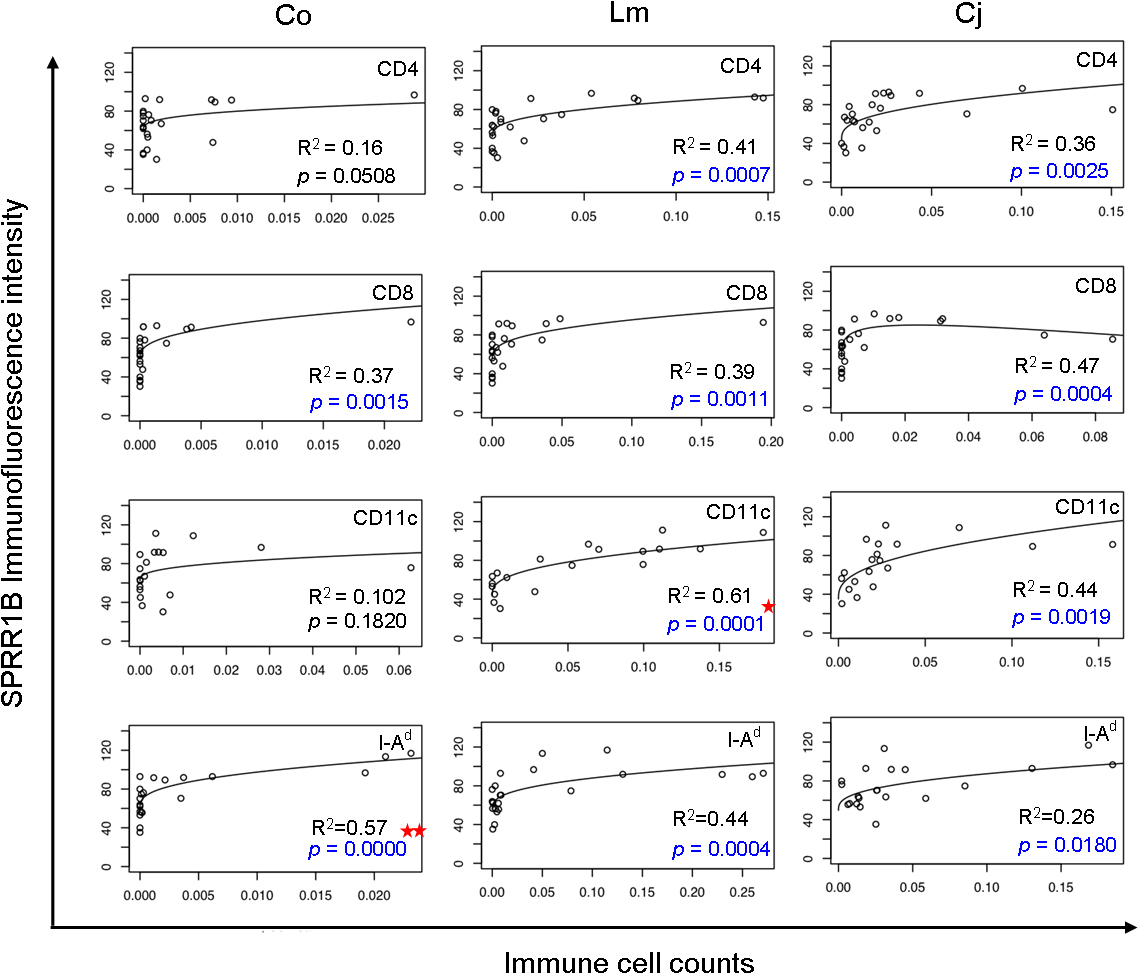
 Figure 7 of Chen, Mol Vis 2009; 15:563-576.