Figure 6. Corneal SPRR1B expression is related to lissamine green staining but not goblet cell density. A: Fifty-eight percent of the variability in corneal SPRR1B (expressed as mean intensity score) is explained by the amount
of lissamine green staining (LG staining; R2=0.58, p=0.0030, n=11) versus only 1% by goblet cell density (GCD) in the right panel (B; R2=0.01, p=0.67, n=19). Open circles represent raw data, and the x-axis plots SPRR1B immuno-intensity in arbitrary units while
the y-axis plots the lissamine green score (A) or GCD (B; cells/section). The straight line is the best-fit linear regression (ordinary least squares)
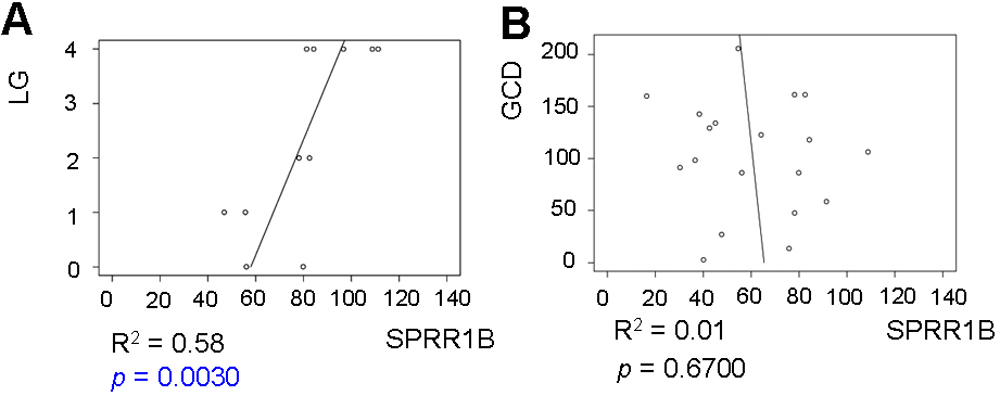
 Figure 6 of
Chen, Mol Vis 2009; 15:563-576.
Figure 6 of
Chen, Mol Vis 2009; 15:563-576.