Figure 4. T cell distribution in the
ocular surface of Aire-deficient mice. Assemblage of low
magnification images showing anatomic locations analyzed in Aire−/−
(A) and Aire+/− (B) mice.
Cj=conjunctiva; Lm=limbus; Co=cornea (paracentral and central).
Immunohistochemistry of CD4+ (C,D) and CD8+
T (E,F) cells demonstrates both epithelial (white arrow)
and stromal (black arrow) infiltration of the ocular surface in Aire−/−.
Aire+/− controls exhibited no cell-mediated
inflammation at the locations analyzed. Bar, 100 μm. G: Time
course of CD4+ and CD8+ cell density in Aire−/−
and Aire+/−. Data are shown as mean±SD. An asterisk
indicates that p<0.05, CD4+Aire+/−
versus CD4+Aire−/−. The symbol, †,
indicates that p<0.05, CD8+Aire+/−
versus CD8+Aire−/−.
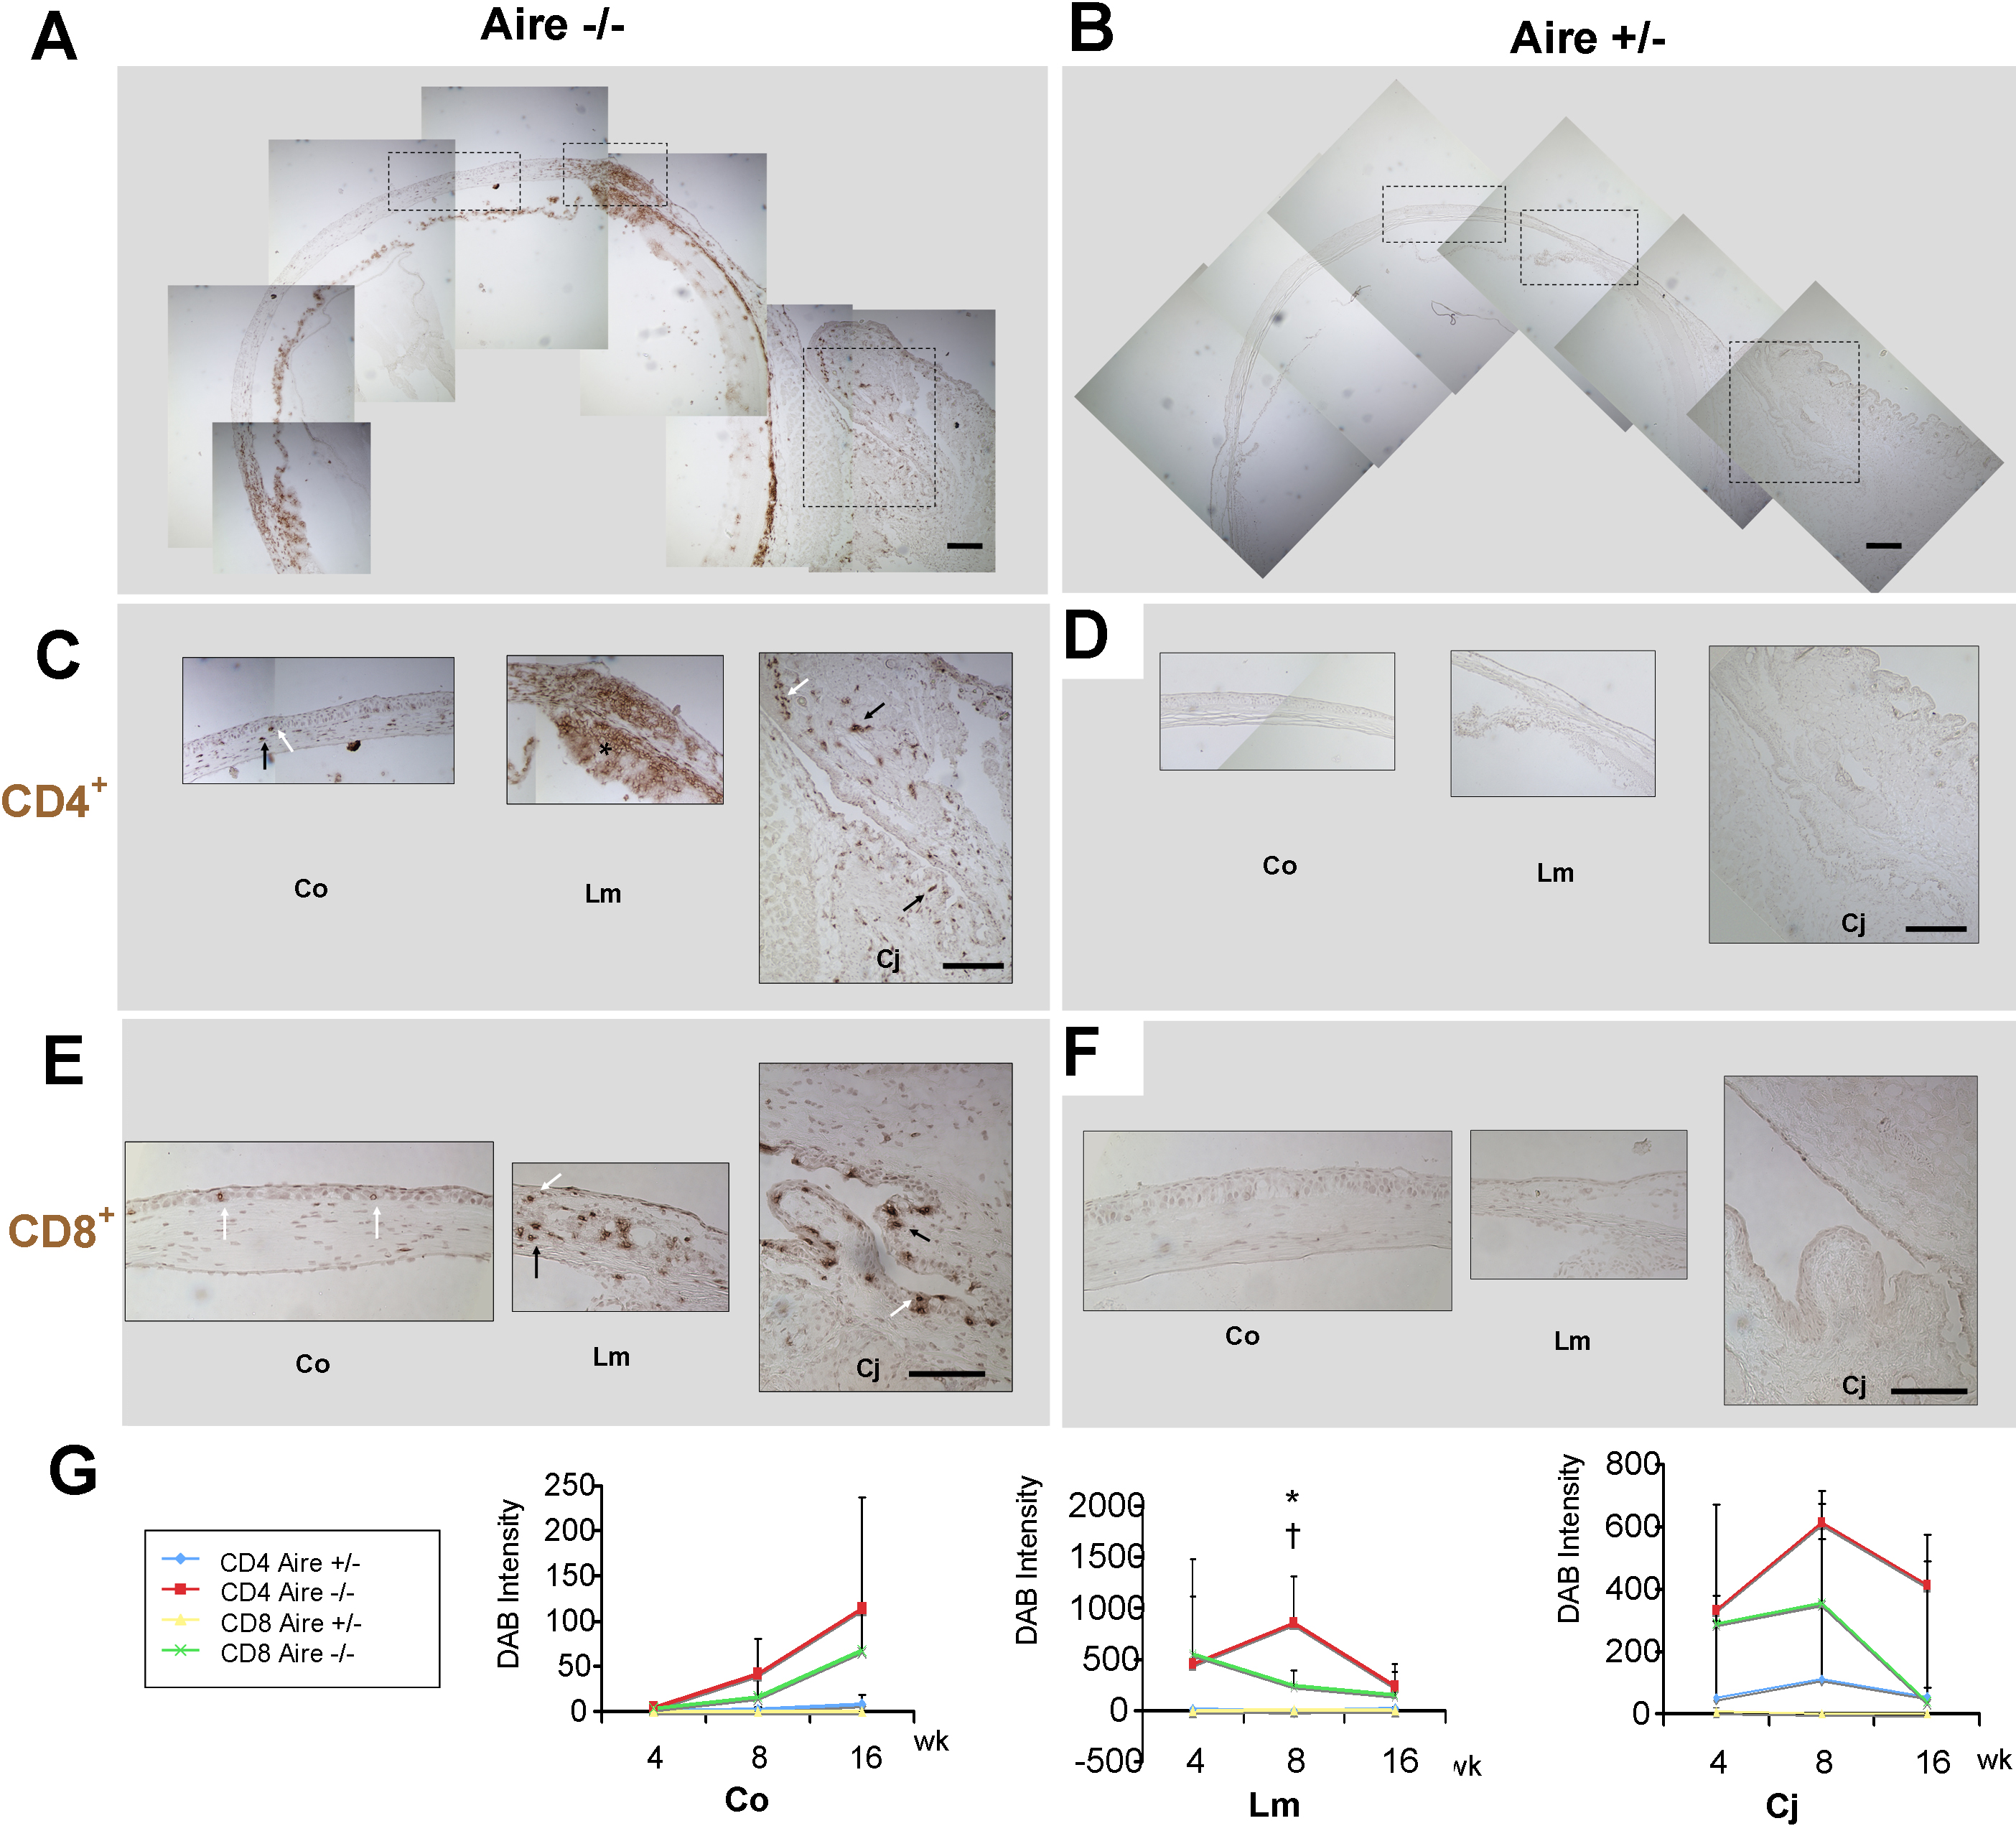
 Figure 4 of Chen, Mol Vis 2009; 15:563-576.