Figure 3. Expression of squamous cell
biomarker, SPRR1B. A: Immunofluorescence showed increased
SPRR1B staining (green) in Aire−/− at all time
points with no staining in age-matched Aire+/−
controls. Bar, 100 μm. B: Quantification of SPRR1B
immuno-intensity over time. Data are shown as mean±SD. An asterisk in
indicates that p<0.05, Aire+/− versus Aire−/−
at each time point.
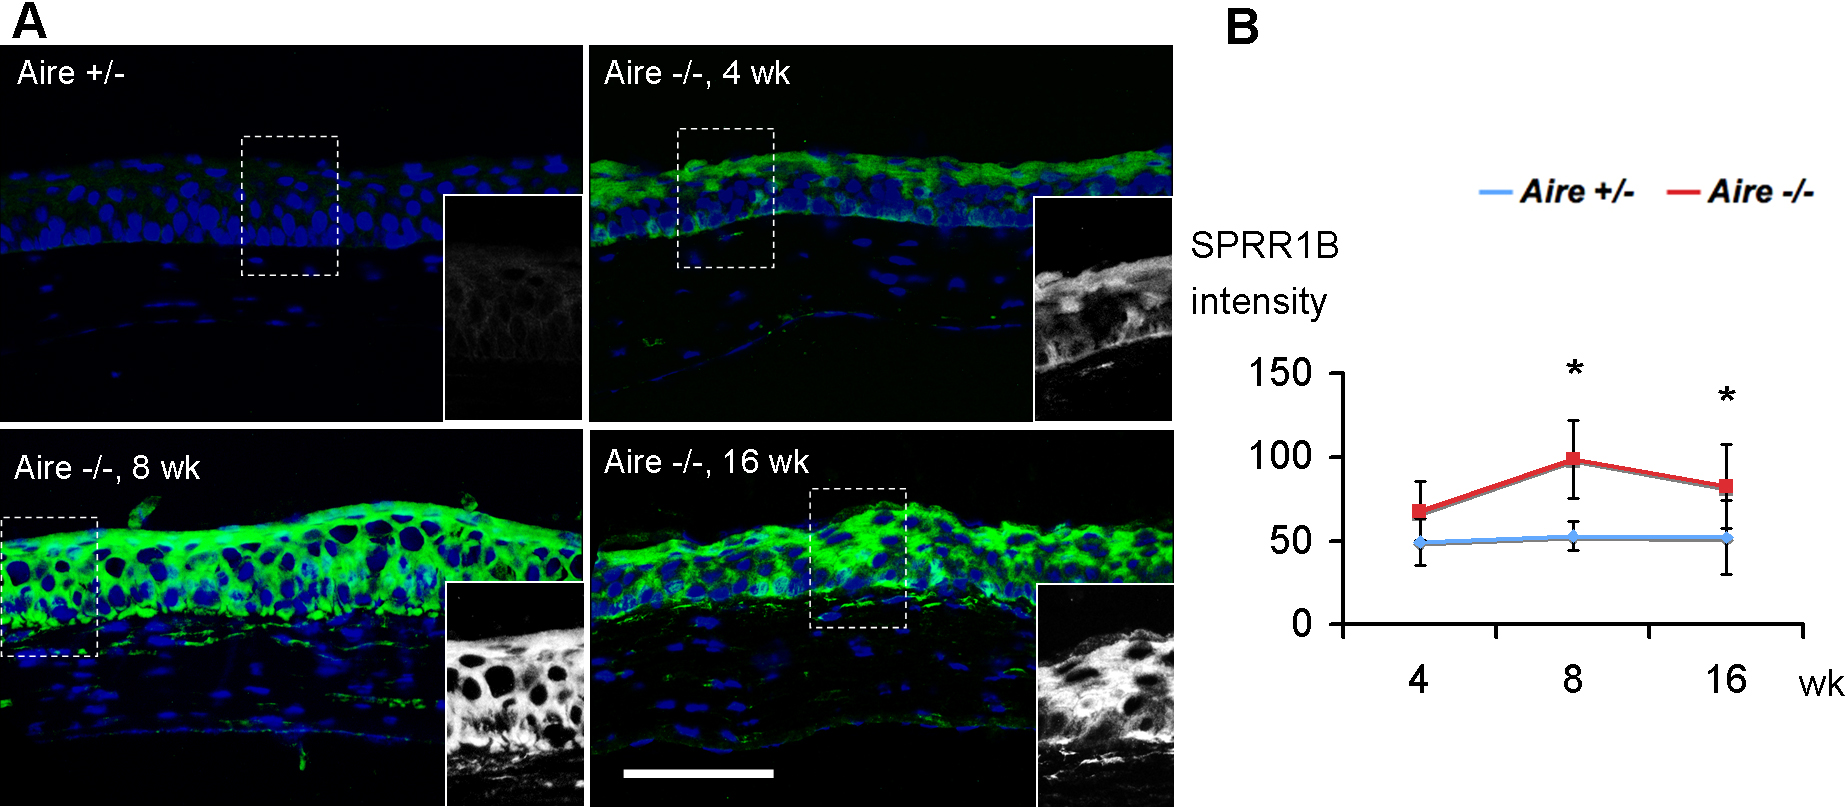
 Figure 3 of Chen, Mol Vis 2009; 15:563-576.