Figure 7. Evaluation of the potential cytotoxicity of myocilin expression. A: HTM cells were transduced with Ad-myocilin-GFP (WT), Ad-myocilin-FLAG (FLAG), Ad-Y437H myocilin-GFP (437), or Ad-stromelysin-GFP
(Str) and stained for GRP78. FITC-conjugated anti-FLAG antibody and DAPI was used to stain myocilin-FLAG and nuclei, respectively.
Each column represents the same cells. The staining patterns of each myocilin (green) and GRP78 (red) merged with DAPI stains
are shown in the upper and lower rows, respectively. Representative images are shown of three independent experiments. B: HTM cells were transduced with Ad-GFP (GFP), Ad-stromelysin-GFP (Str), Ad-myocilin-GFP (WT), or Ad-Y437H myocilin-GFP (437)
and cultured for 48 h (upper row) or 96 h (lower row). After fixing and staining with DAPI, the green fluorescence of GFP
or GFP fusion proteins were merged with DAPI stains. Representative images are shown of three independent experiments. Bar:
50 μm. The graph is plotted values showing the ratio of GFP-expressing cells to nontransduced cells. Data represents means±standard
deviation from 200 cells.
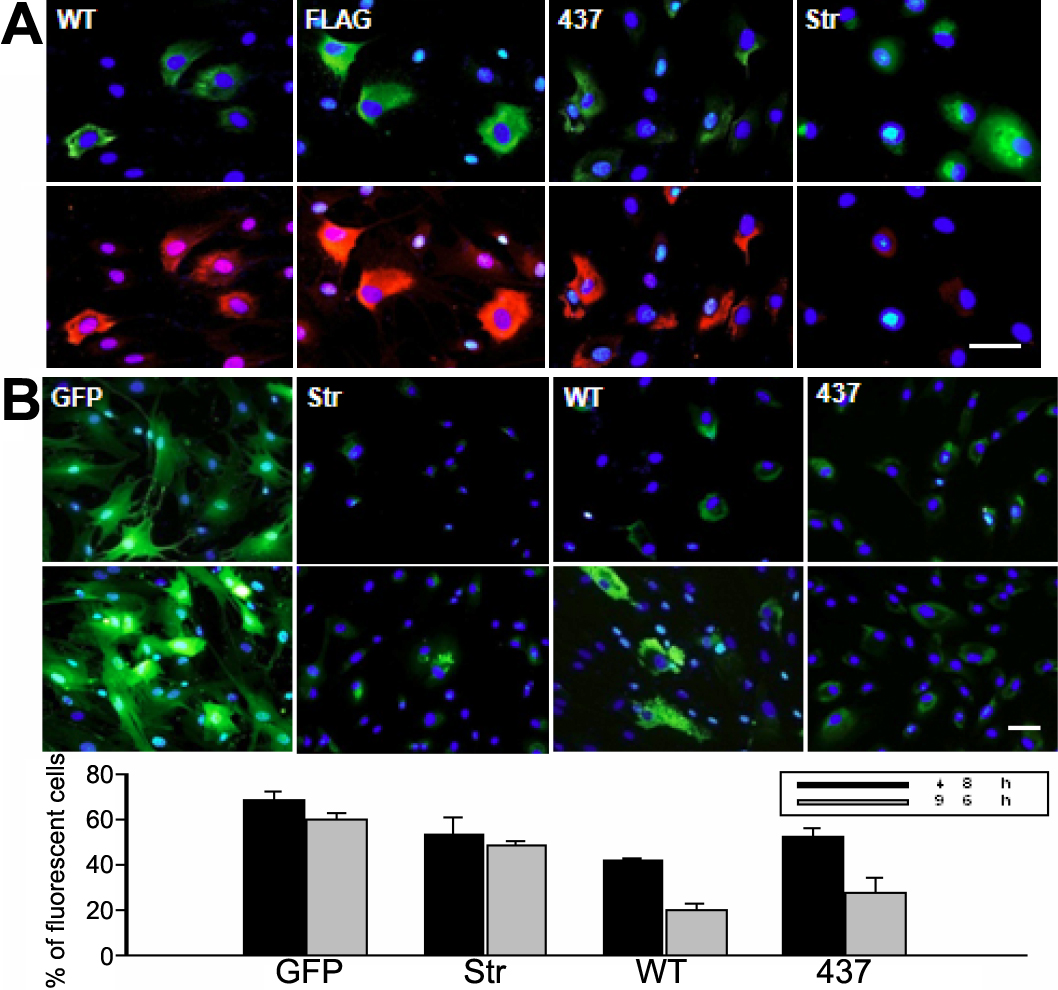
 Figure 7 of
Sohn, Mol Vis 2009; 15:545-556.
Figure 7 of
Sohn, Mol Vis 2009; 15:545-556.