Figure 6. Fluorescence microscopic analysis of myocilin expression. A: HTM cells were transduced with Ad-myocilin-GFP (WT) or Ad-Y437H myocilin-GFP (437) at an MOI of 10 pfu and expressed for
48 h. After fixing and staining with DAPI, myocilin expression (green) and DAPI staining (blue) were merged. Representative
images are shown of three independent experiments. The graph is plotted values showing the ratio of GFP-expressing cells to
nontransduced cells. Data represents means±standard deviation from 200 cells. B: HTM cells were transduced with Ad-myocilin-FLAG at an MOI of 10 pfu followed by transduction of Ad-Y437H myocilin-GFP at
an MOI of 0 pfu (left column), 5 pfu (middle column), and 10 pfu (right column). Myocilin-FLAG was detected with anti-FLAG
antibody. Images of red fluorescence from myocilin-FLAG (upper row) or green fluorescence from Y437H myocilin-GFP (lower row)
were merged with DAPI stains. Each column represents the same cells. Representative images are shown of three independent
experiments. The graph is plotted values showing the ratio of red fluorescence-positive cells to nontransduced cells. Data
represents means±standard deviation from 200 cells. C: HTM cells were transduced with red fluorescence (CM-Dil)-labeled Ad-myocilin-GFP. Green (upper panel) and red fluorescence
(lower panel) overlapped with nuclear stains correspond to myocilin expression and cellular uptake of viral particles, respectively.
Each column represents the same cells. Representative images are shown of three independent experiments. Bar: 50 μm.
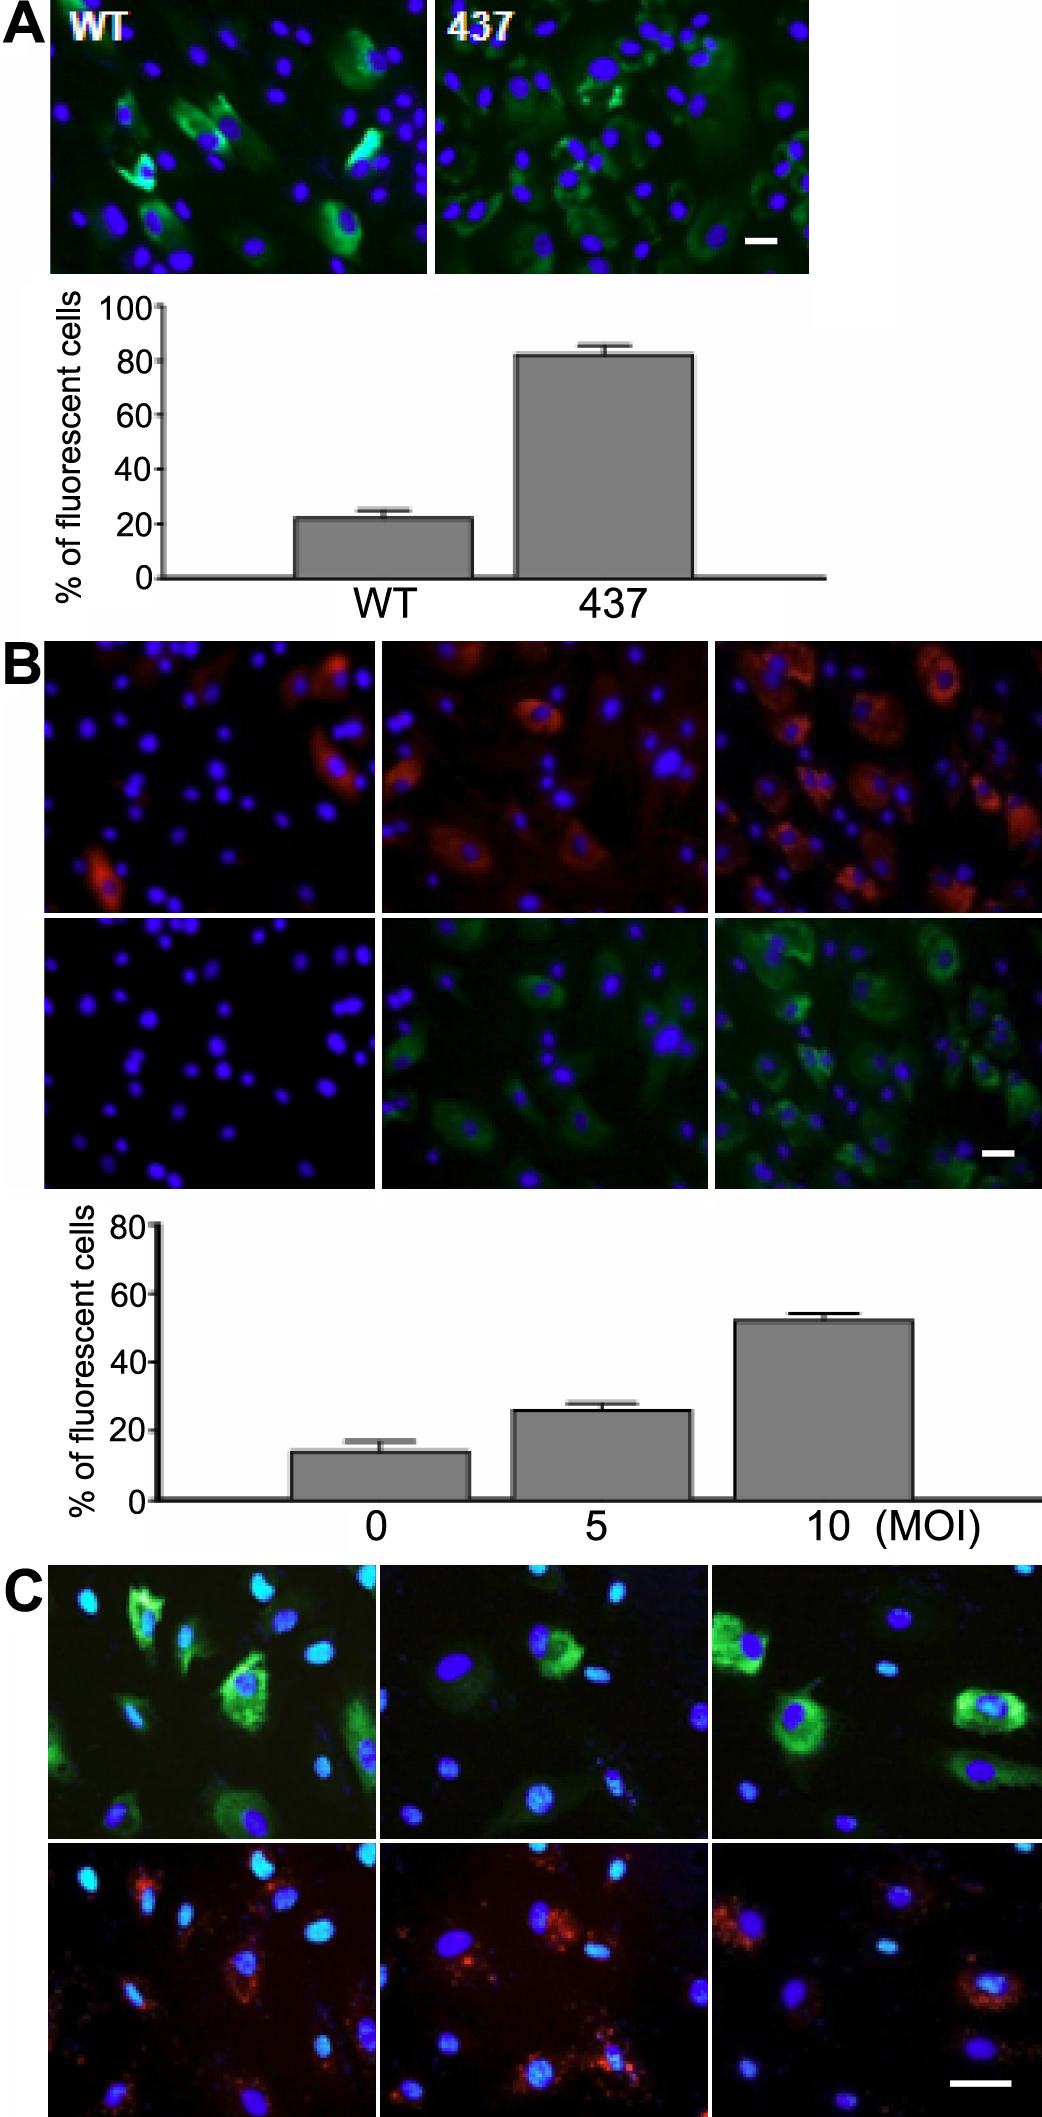
 Figure 6 of
Sohn, Mol Vis 2009; 15:545-556.
Figure 6 of
Sohn, Mol Vis 2009; 15:545-556.